Test- FTSE 100 Kicks Off August on a High as BP and Senior Lead Market Momentum
$11
10 Oct 2025, 13:13
Neutral
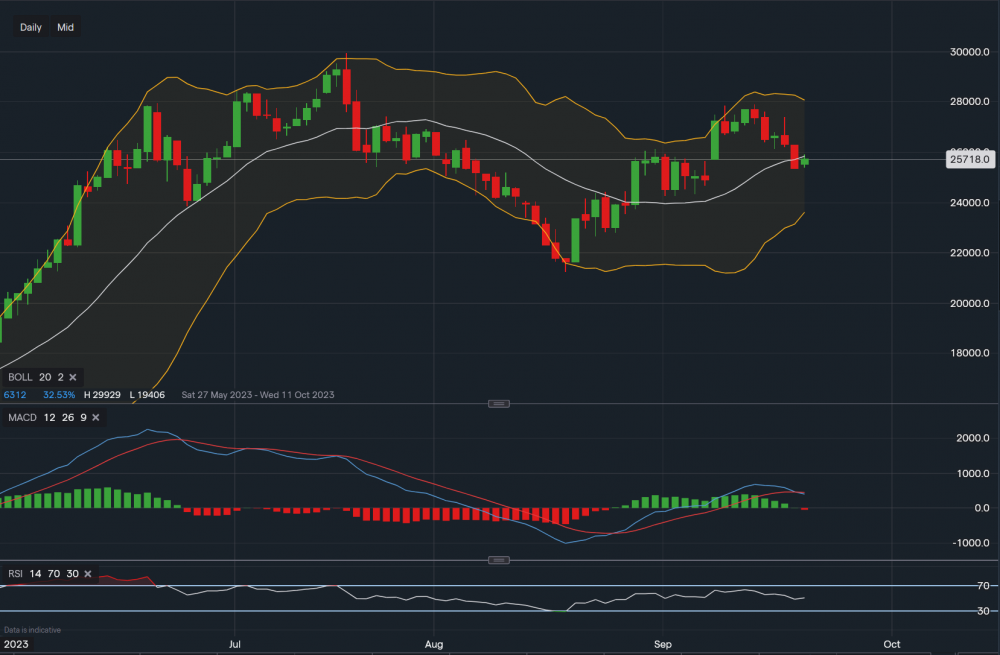
Chart & Data from IG
Taking a look at Tesla as it had a great rally but now some weakness is starting to show, especially after the hawkish Fed. Currently, its stock is trading at around $257.18 a share. If we apply the Bollinger Bands to the chart, we can see that the price in yesterday’s session has dipped below the middle moving average now, suggesting that we may see some more downside. The support now sits at $253.51 (yesterday’s low), then at $250.51 and then at $243.27. A break below $243.27 could see the price fall to as low as $236.04, testing the lower Bollinger Band. If we look at the technical indicators, they are mixed as the MACD seems to be turning negative but the RSI is still fairly neutral as it reads 50. It would be unreliable to look towards the upside for the time being as the short-term bias is edging towards the bearish viewpoint, although the price remains in a neutral stance making the direction harder to gauge.

Tradable assets:
Min.Deposit:
Max Leverage:
FCA:

Rating:


