Test- FTSE 100 Kicks Off August on a High as BP and Senior Lead Market Momentum
$11
10 Oct 2025, 13:13
Neutral
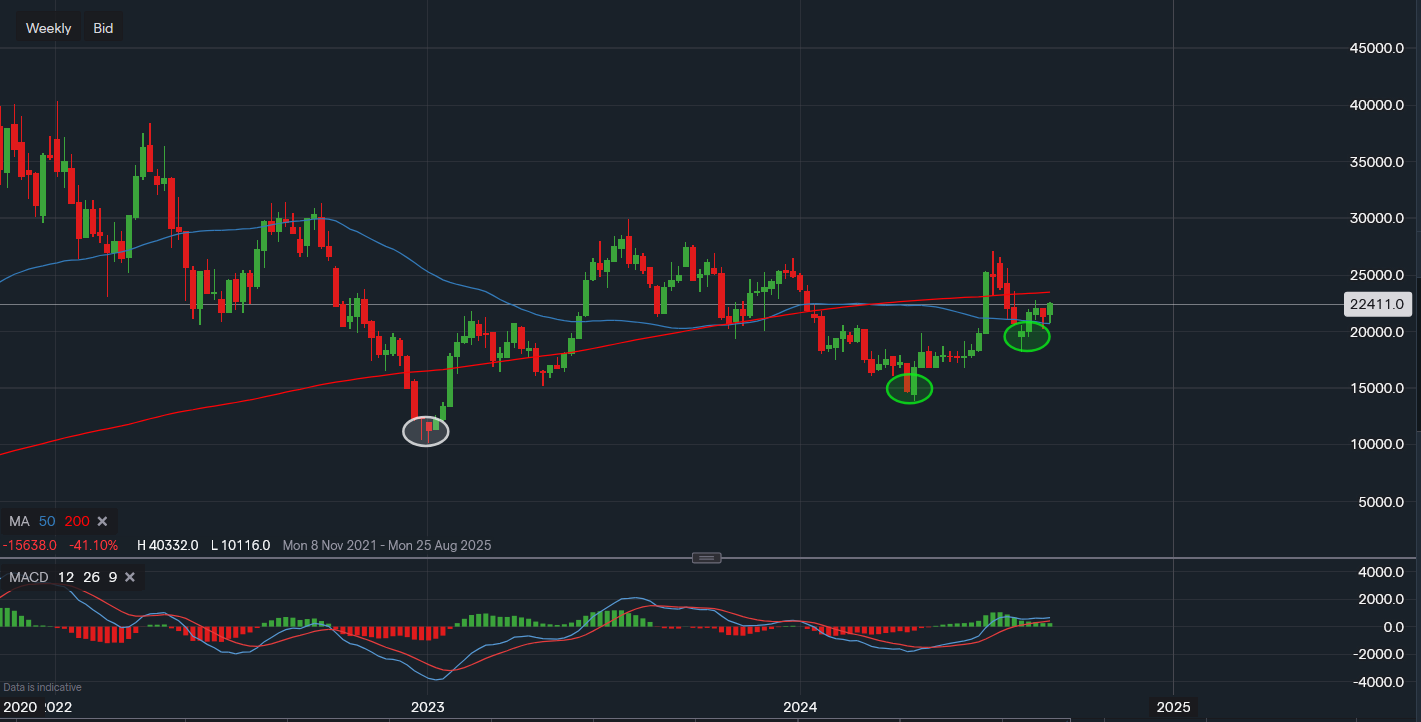
Chart & Data from IG
Taking a look at Tesla on the weekly chart as potentially a fresh higher low has been formed. The EV giant’s share price is trading at around $224.11 a share after falling to $181.96 following a rally above the 200-day moving average. We can see the recent sell-off brought the price back below the 200MA again, with this now being in the spotlight as the key resistance point. The 200MA is currently reading $234.69, and a break above it once again would strengthen the view that the stock has formed a new higher low at $181.96. This would increase the likelihood of a rally toward a new higher high, but of course, would first require a move above the resistance around the most recent high of $270.73. The 50MA has provided fine support over the last 4 weeks, currently reading $206.94. A dip below it would certainly increase the selling volume, especially with the September seasonality and possible weakness in October ahead of the US elections. However, a break below the support of $181.96 for any further downside. From a momentum-based perspective, the MACD still suggests bullish. Although, the volume has somewhat faded.

Tradable assets:
Min.Deposit:
Max Leverage:
FCA:

Rating:


