Test- FTSE 100 Kicks Off August on a High as BP and Senior Lead Market Momentum
$11
10 Oct 2025, 13:13
Neutral
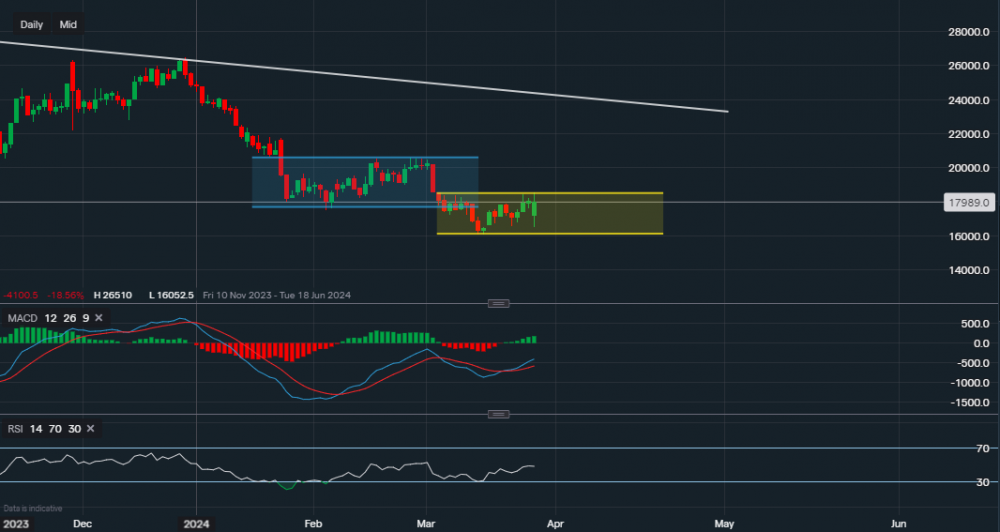
Chart & Data from IG
Taking a look at Tesla’s stock as the EV giant has received some caution warnings as of late from analysts ahead of Q1 delivery figures. Currently, its shares are trading at around $179.89 a share. We can see that on the daily chart, the trading range has now shifted lower, sitting within the yellow channel. Or respectively, between $160-$185. The resistance here now for Tesla is clearly the price level of $185 as it has struggled to move past this point on a couple of occasions. A break and close above this level would see the price move back into the blue channel with the intention to consolidate before finding ground for a push back up towards the $200 mark. However, Telsa may find it difficult to do so after the recent downgrades from institutions. Towards the downside, the key support is the level of $160.80. A break below this level would certainly entice the bears to increase selling pressure towards $150. The technical indicators are somewhat positive, with MACD now positive once again and the RSI is back to neutral, reading 48. It may also be worth pointing out that there exists a bullish divergence on the MACD, with the indicator forming higher lows but the price of the stock is forming lower lows. But this should not be used alone as indication for entering the market as the markets can be deceiving.

Tradable assets:
Min.Deposit:
Max Leverage:
FCA:

Rating:


