Test- FTSE 100 Kicks Off August on a High as BP and Senior Lead Market Momentum
$11
10 Oct 2025, 13:13
Neutral
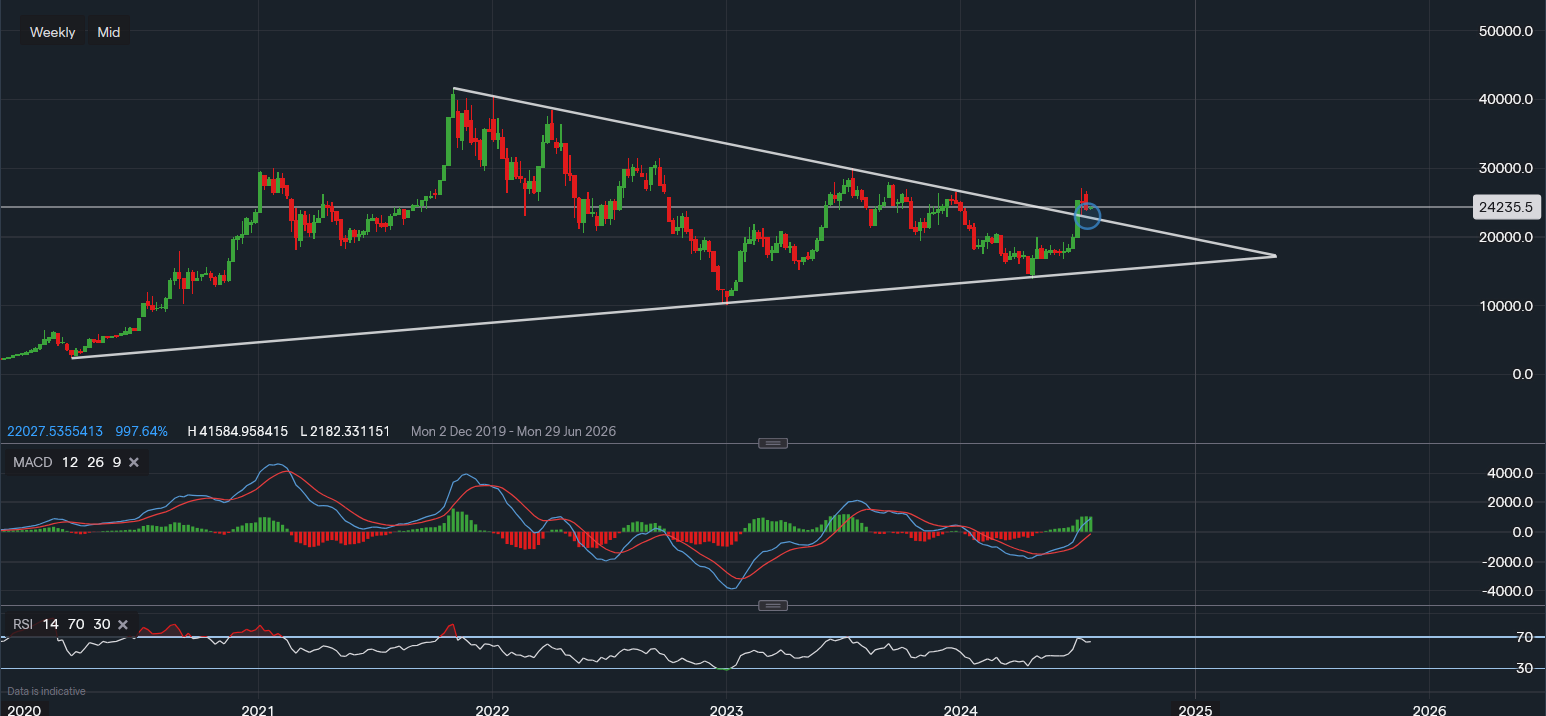
Chart & Data from IG
Tesla is heading for a potential test of this flip zone from resistance to support along the descending trendline. The EV giant’s shares are floating around $242.35 in the pre-market and are up so far 1.4% on the day. After finding some resistance around $270.80 following a rally of more than 50% since June, it seems like some profit-taking is taking course. Trendline support reads $226.59, a break below it would see the price move back into the triangle area. Such a move may create some concern for investors as it may be a signal of a false breakout, potentially leading to some caution and further selling. However, until then, the breakout is still valid. As already mentioned, the resistance for the near term is $270.80. A move above this level in the weeks following the earnings would certainly confirm this breakout. This would allow investors to eye the highs of July last year, or respectively, $300 a share. Looking at the technical indicators, they continue to support the bullish momentum view. The MACD is still very positive and so is the RSI as it reads 63.

Tradable assets:
Min.Deposit:
Max Leverage:
FCA:

Rating:


