Test- FTSE 100 Kicks Off August on a High as BP and Senior Lead Market Momentum
$11
10 Oct 2025, 13:13
Neutral
admin.com
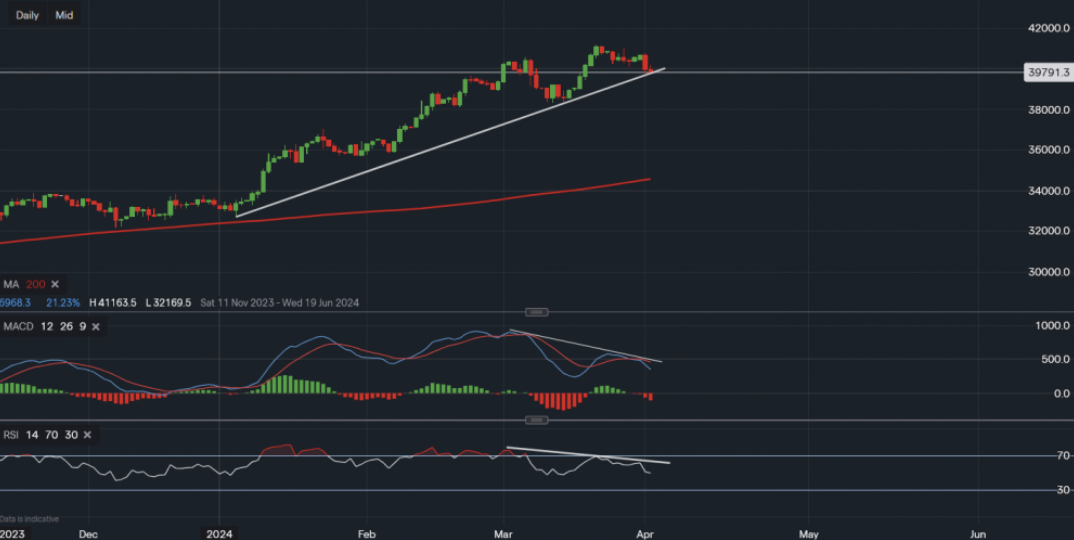
Taking a look at JNJ as it seems like it may now be slightly oversold on the bigger timeframes, with the daily timeframe showing potential consolidation. Currently, its stock is trading at around $145.80 a share in the pre-market trade. We can see that a potential support base has been created, which is outlined using the blue channel. This support dates back to October of last year, reading $143.34. This level was tested back in April but the price managed to close higher, leading to a short-term bounce. We can see the bounce then faded leading to two further tests of support around the area between $143-$144. The resilience of this support so far has been highlighted by the green ovals. A break and close below $143 would be a bearish indication, increasing the likelihood of further declines toward those COVID lows of $135-$140. On the other hand, a move above the near-term resistance of $148-$149 could spark a new rally for JNJ. Investors would then target the area of $155 as this would then become the area of focus in order to determine the longer-term outlook for the stock. Looking at the technical indicators, they are both still negative but stability seems present. The MACD is flat with the potential of turning positive and the RSI reads 43 compared to the low in May of 35.
Taking a look at JNJ as it seems like it may now be slightly oversold on the bigger timeframes, with the daily timeframe showing potential consolidation. Currently, its stock is trading at around $145.80 a share in the pre-market trade. We can see that a potential support base has been created, which is outlined using the blue channel. This support dates back to October of last year, reading $143.34. This level was tested back in April but the price managed to close higher, leading to a short-term bounce. We can see the bounce then faded leading to two further tests of support around the area between $143-$144. The resilience of this support so far has been highlighted by the green ovals. A break and close below $143 would be a bearish indication, increasing the likelihood of further declines toward those COVID lows of $135-$140. On the other hand, a move above the near-term resistance of $148-$149 could spark a new rally for JNJ. Investors would then target the area of $155 as this would then become the area of focus in order to determine the longer-term outlook for the stock. Looking at the technical indicators, they are both still negative but stability seems present. The MACD is flat with the potential of turning positive and the RSI reads 43 compared to the low in May of 35.Taking a look at JNJ as it seems like it may now be slightly oversold on the bigger timeframes, with the daily timeframe showing potential consolidation. Currently, its stock is trading at around $145.80 a share in the pre-market trade. We can see that a potential support base has been created, which is outlined using the blue channel. This support dates back to October of last year, reading $143.34. This level was tested back in April but the price managed to close higher, leading to a short-term bounce. We can see the bounce then faded leading to two further tests of support around the area between $143-$144. The resilience of this support so far has been highlighted by the green ovals. A break and close below $143 would be a bearish indication, increasing the likelihood of further declines toward those COVID lows of $135-$140. On the other hand, a move above the near-term resistance of $148-$149 could spark a new rally for JNJ. Investors would then target the area of $155 as this would then become the area of focus in order to determine the longer-term outlook for the stock. Looking at the technical indicators, they are both still negative but stability seems present. The MACD is flat with the potential of turning positive and the RSI reads 43 compared to the low in May of 35.Taking a look at JNJ as it seems like it may now be slightly oversold on the bigger timeframes, with the daily timeframe showing potential consolidation. Currently, its stock is trading at around $145.80 a share in the pre-market trade. We can see that a potential support base has been created, which is outlined using the blue channel. This support dates back to October of last year, reading $143.34. This level was tested back in April but the price managed to close higher, leading to a short-term bounce. We can see the bounce then faded leading to two further tests of support around the area between $143-$144. The resilience of this support so far has been highlighted by the green ovals. A break and close below $143 would be a bearish indication, increasing the likelihood of further declines toward those COVID lows of $135-$140. On the other hand, a move above the near-term resistance of $148-$149 could spark a new rally for JNJ. Investors would then target the area of $155 as this would then become the area of focus in order to determine the longer-term outlook for the stock. Looking at the technical indicators, they are both still negative but stability seems present. The MACD is flat with the potential of turning positive and the RSI reads 43 compared to the low in May of 35.

Tradable assets:
Min.Deposit:
Max Leverage:
FCA:

Rating:


