Test- FTSE 100 Kicks Off August on a High as BP and Senior Lead Market Momentum
$11
10 Oct 2025, 13:13
Neutral
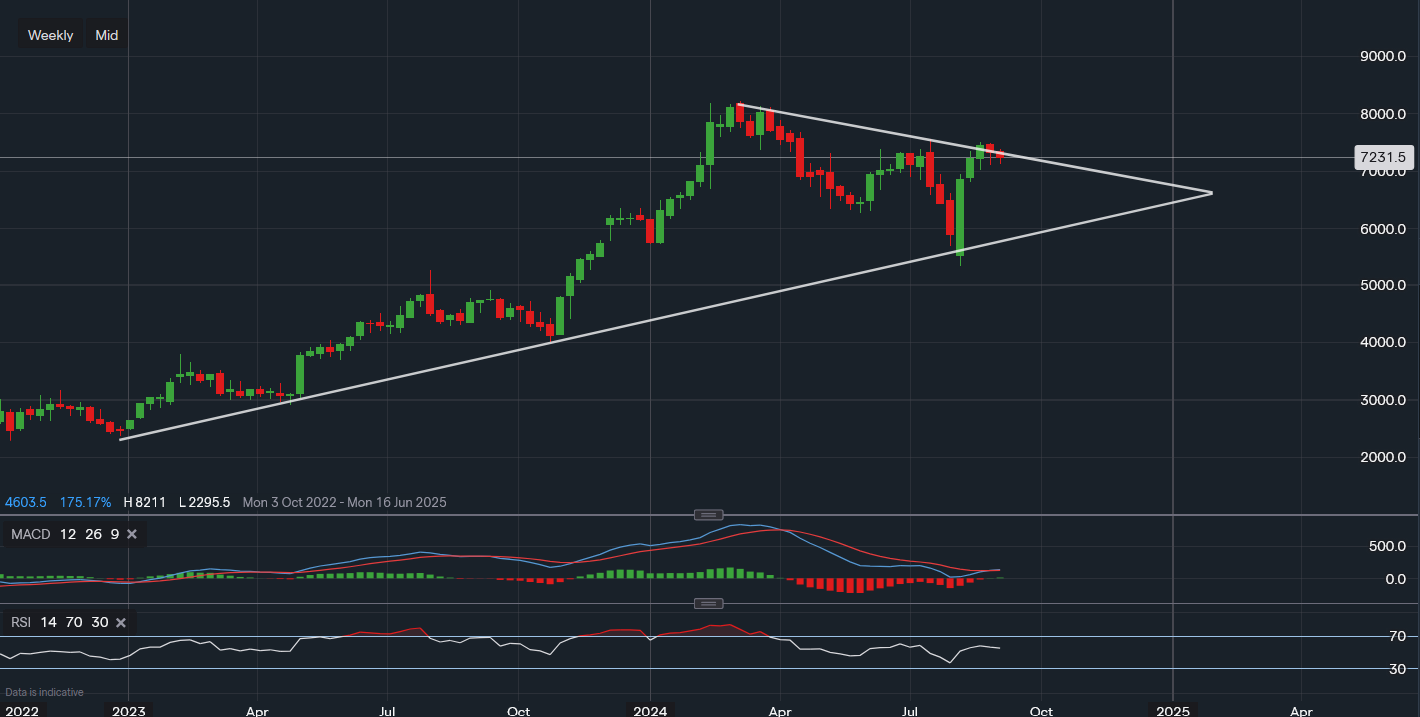
Chart & Data from IG
Uber facing tough resistance along the upper trendline on the weekly chart. After making a significant recovery in August following the sell-off in July, what happens next may set the tone of this stock in the near term. Currently, its shares are trading at around $72.31 a share after a failed attempt to move higher, coming across resistance around $74.95. There is further resistance around $75.56. The price is now trading in and around the trendline, which acts as either technical support or resistance. A move above $75.56 would be required to minimise any downside risk, as the entire US market treads water with jobs data due on Friday and Fed interest rate decision due 17-18th. This poses a risk to the downside as investors could turn ‘risk-off’, failure to close above the upper trendline may lead to another leg lower. The first support level can be found around $68.38 then at $62.65. A break below $62.65 would shift the attention to the lower trendline once again. The technical indicators are a little mixed, which indicates signals for caution. The MACD seems like it’s trying to turn bullish but it’s yet to do so. Whereas the RSI is gradually sliding lower as it now reads 55. This is a possible suggestion that the momentum is starting to stall.

Tradable assets:
Min.Deposit:
Max Leverage:
FCA:

Rating:


