Test- FTSE 100 Kicks Off August on a High as BP and Senior Lead Market Momentum
$11
10 Oct 2025, 13:13
Neutral
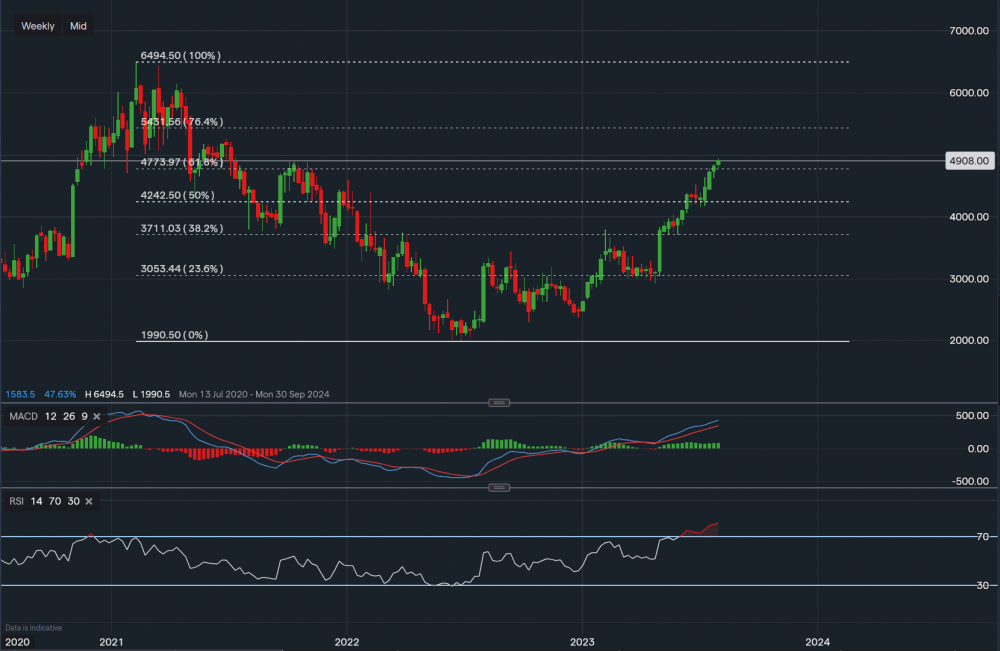
Chart & Data from IG
Applying the Fibonacci retracement to the chart of Uber as the company is due to report quarterly earnings tomorrow. It is currently trading at around $49.08 a share, we can see that on the weekly interval, it has closed above the 61.8% Fib ($47.73). This can be viewed as a positive sign for a continuation higher in the short-term, with the next level of resistance sitting at $52.67 followed by $54.31 (76.4% Fib). A break above the 76.4% Fib could lead to a move back up to the all-time highs, last seen in March 2021. On the other hand, if we look at the RSI (technical indicator), it reads 81, suggesting the stock is overbought. As a result, we may see a retracement before pushing higher. The MACD is comfortably positive, suggesting the momentum remains. The earnings will play a key part in the near-term direction. It could be a case of positive earnings leading to a surge higher before a retracement occurs, or simply just a continuation higher. However, investors/traders should be cautious as a negative outcome can also lead to an instant pullback.


