Test- FTSE 100 Kicks Off August on a High as BP and Senior Lead Market Momentum
$11
10 Oct 2025, 13:13
Neutral
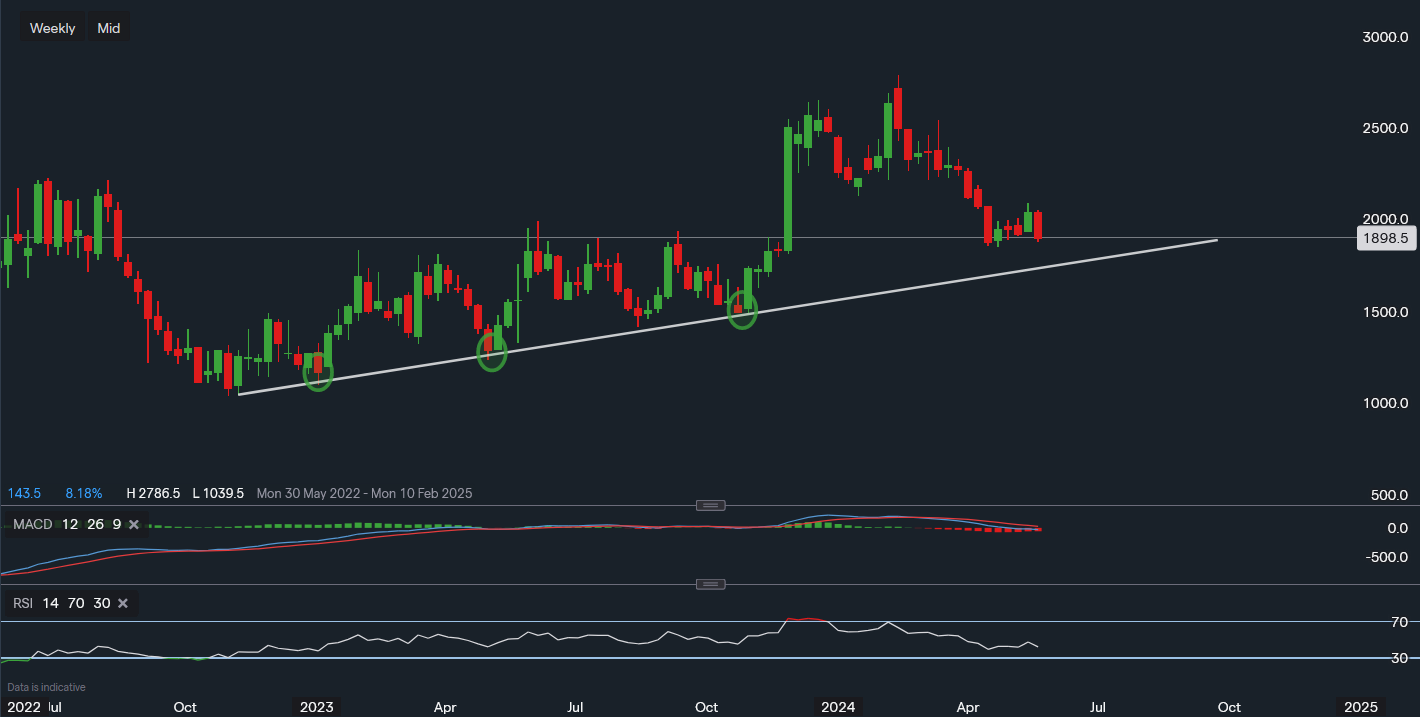
Chart & Data from IG
Taking a look at UiPath as the sell-off from the previous earnings call has continued throughout March-May. Its share price closed last week at $18.98 a share. Looking at the history of the chart, we can see that the trendline drawn on the chart has been acting as a key line of support. On three separate occasions when the price has reached the trendline, it has bounced towards the upside. This is highlighted by the green ovals. With the tech firm reporting earnings tomorrow, we may see yet another test of this trendline support. The support along the trendline reads $17.31, if history was to repeat itself, we may see a bounce back up to $20 a share and perhaps beyond on positive earnings. A break below this trendline support would see investors shift their focus towards the October low, or respectively, $14.89. For the time being, the primary resistance in focus here is $20.93 (last week’s high). The concern here for the near future is the technical indicators, the MACD is still negative without signs of bottoming out as of yet. The RSI is also negative as it reads 42.

Tradable assets:
Min.Deposit:
Max Leverage:
FCA:

Rating:


