Test- FTSE 100 Kicks Off August on a High as BP and Senior Lead Market Momentum
$11
10 Oct 2025, 13:13
Neutral
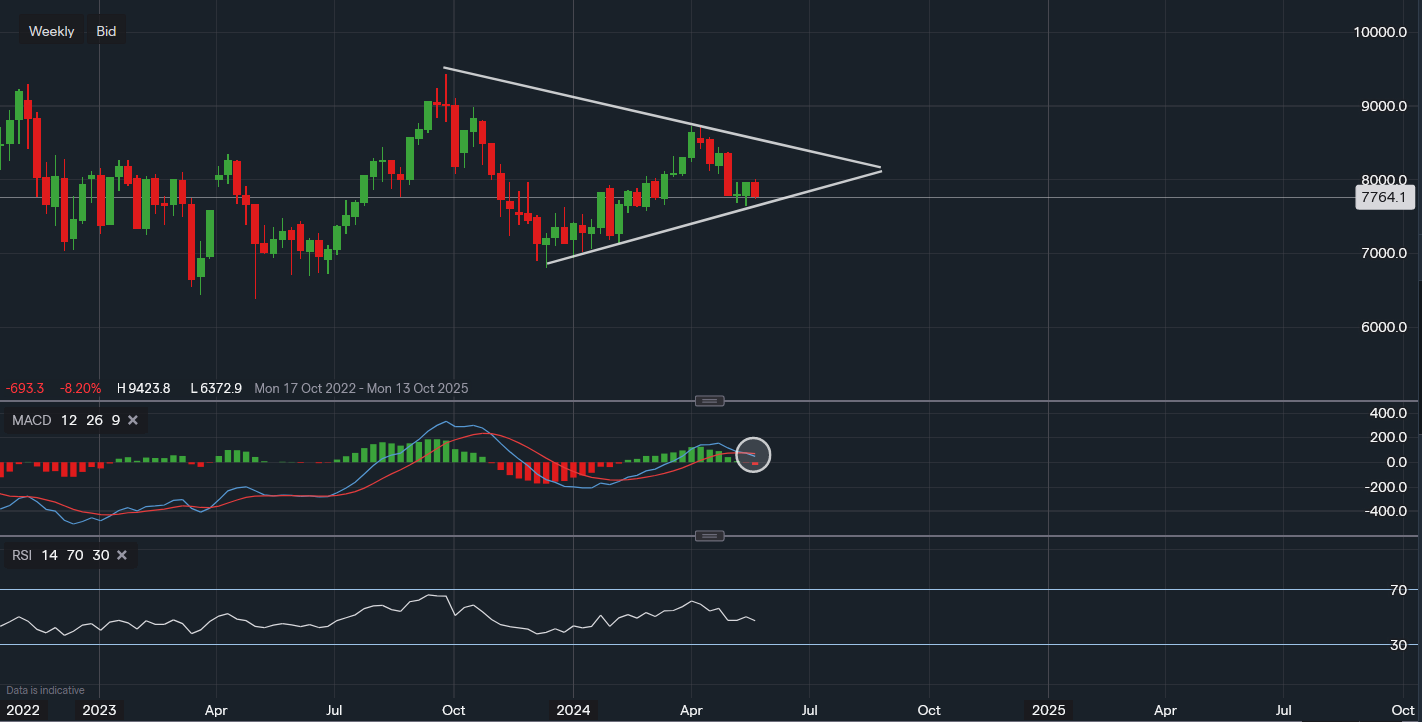
Chart & Data from IG
US crude oil is now approaching a clear support level here on the weekly chart. Currently trading at around $77.64 a barrel. We can see that a support level was formed at $76.41 after the April sell-off, with now the trendline support of $76.36 in focus. A break below the ascending trendline could increase the bearish momentum and lead to a move lower, with the next area of support after that around $71-$72. As the commodity seems to be in a bearish trend with the market down almost 1% on the day, it would be unreliable to point out any resistance levels. However, if there are signs of consolidation along the trendline or current price level. In that case, the focus would revert to the $80 mark. Looking at the technical indicators, the MACD stands out more out of the two. The MACD line has crossed below its signal line, suggesting that selling pressure is increasing. This may lead to further declines in the near term. However, this is not guaranteed and even though the RSI is also faltering, it is still reading 47 (neutral).

Tradable assets:
Min.Deposit:
Max Leverage:
FCA:

Rating:


