Test- FTSE 100 Kicks Off August on a High as BP and Senior Lead Market Momentum
$11
10 Oct 2025, 13:13
Neutral
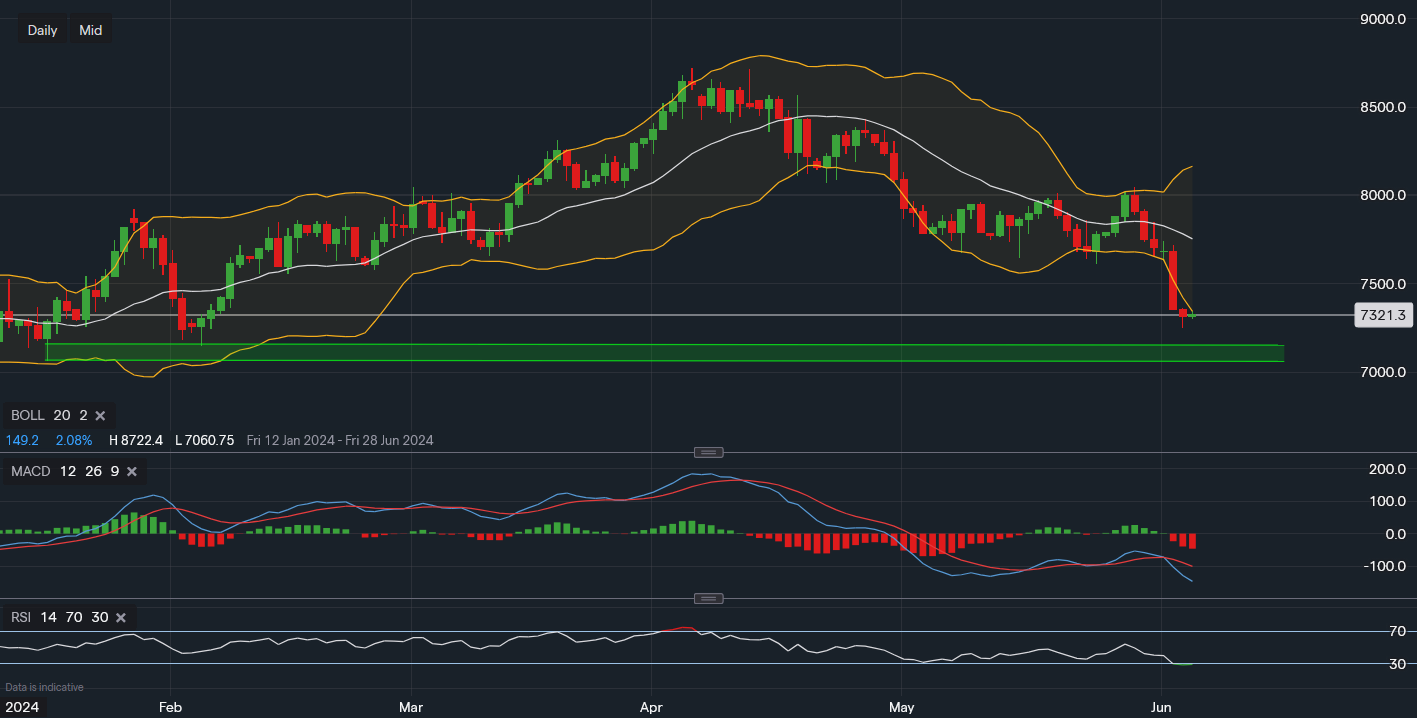
Chart & Data from IG
Taking a look at US crude oil as it now looks oversold on the daily timeframe. Currently, USO is trading at around $73.21 a barrel after 5 straight days in the red. Yesterday’s candlestick closed strongly outside of the Bollinger Bands, with the price now at a 4-month low, buyers may see this as an opportunity for a small bounce back over the next couple of sessions. The new support is yesterday’s low of $72.45, a break below could see the commodity slide into the support area below outlined using the green channel. This channel is a key support area, ranging from $70.60-$71.44, which are the lows of the year and should show some resilience if the price was to enter the zone. If the market is showing signs of consolidation around current levels, traders could look towards the area of $74-$75 as this will be the primary resistance zone. Regarding the technical indicators, they are now bearish which suggests that further downside pressure may persist. However, the RSI is now at the most oversold level its been since the 8th of November. The RSI reads 28, when it was reading 28th in November, USO went on to rally 5-6%. Nonetheless, past price action does not always determine the price action in the future.

Tradable assets:
Min.Deposit:
Max Leverage:
FCA:

Rating:


