Test- FTSE 100 Kicks Off August on a High as BP and Senior Lead Market Momentum
$11
10 Oct 2025, 13:13
Neutral
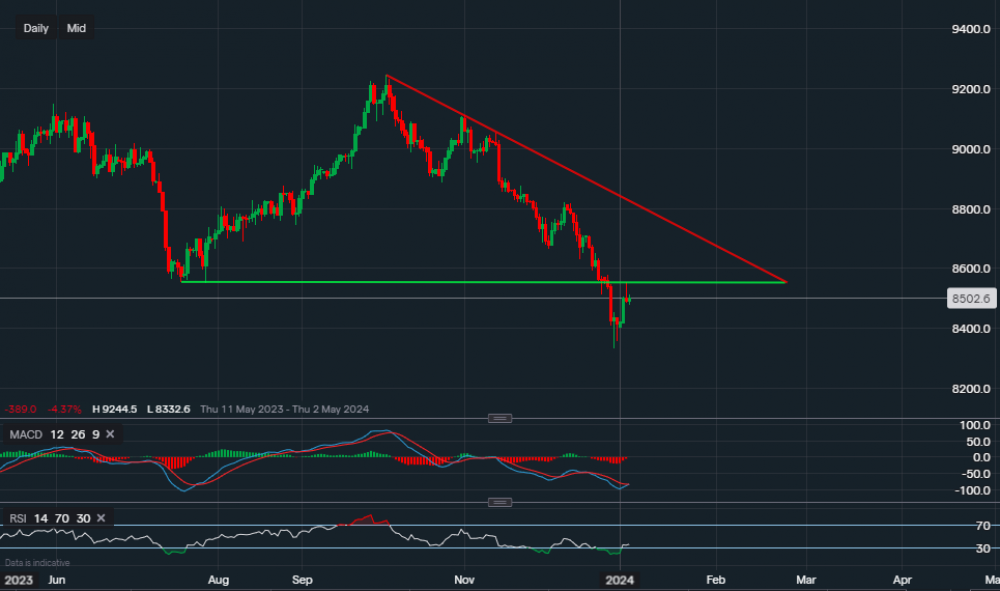
Chart & Data from IG
Taking a look at the USD/CHF pair after it broke below its key support of $0.8555 (green trendline). The pair broke below the support just after Christmas closing at a low of $0.8408, the following day a hammer candlestick appeared at the end of the session. Since then, we can see that the pair has tried to move higher testing $0.8555, which is now acting as resistance. But it was rejected. The bias continues to remain bearish unless there is a break and close above the resistance of $0.8555. The new support level here in focus is $0.8332. A break below could lead to a slide lower towards $0.8200. However, it is important to note that this is the lowest level since January 2015. When similar levels were reached back in 2015, a rally was ignited through to March (a rise of 19%). This is shown on the weekly chart below. Nevertheless, the indicators do not offer any confidence for bulls as the MACD is still negative, although turning flat, and the RSI is negative as it reads 35. The outlook on the weekly chart is almost similar, but the MACD is showing to be more bearish.
 (Chart & Data from IG)

Tradable assets:
Min.Deposit:
Max Leverage:
FCA:

Rating:


