Test- FTSE 100 Kicks Off August on a High as BP and Senior Lead Market Momentum
$11
10 Oct 2025, 13:13
Neutral
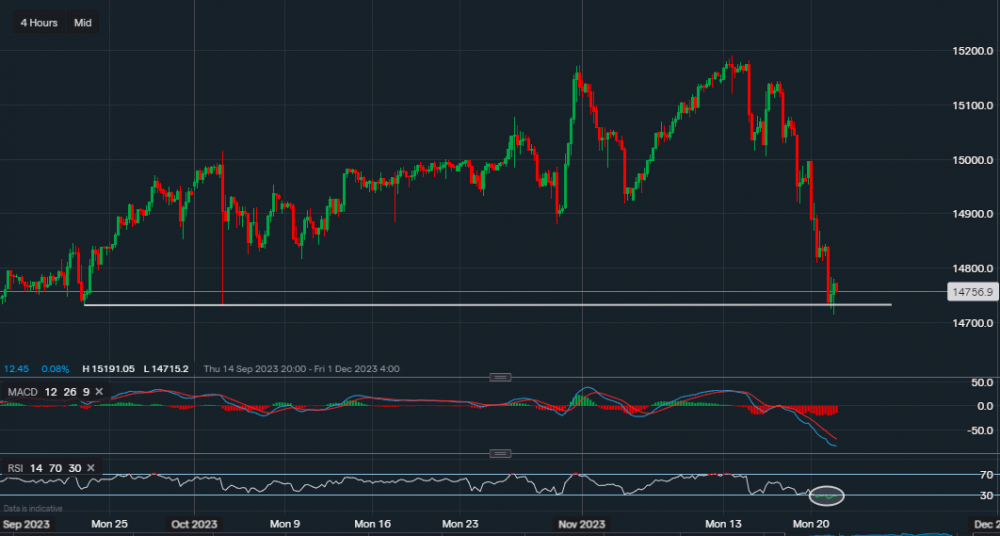
Chart & Data from IG
The US dollar has been getting hammered since last week after the US inflation data showed signs of cooling within the American economy. USD/JPY last Monday almost reached a high of $1.52, it has since fallen and the forex pair is now trading at around $1.4756. Looking at the 4-hourly timeframe, we can see that the pair has approached a key support level of $1.4744. The pair briefly dipped below this level but has managed to bounce back above. A close below this support level would suggest that further downside is possible, with the following support sitting at $1.4702. The bias has now turned bearish, so it would be unreliable to look towards any resistance levels at this moment in time, However, if there is some consolidation around current levels, the bulls would face resistance at $1.4775 and then at $1.4795. Looking at the technical indicators, they are clearly in the negative zone with the RSI reading 28. Although, the RSI does suggest that the pair is currently slightly oversold.

Tradable assets:
Min.Deposit:
Max Leverage:
FCA:

Rating:


