Test- FTSE 100 Kicks Off August on a High as BP and Senior Lead Market Momentum
$11
10 Oct 2025, 13:13

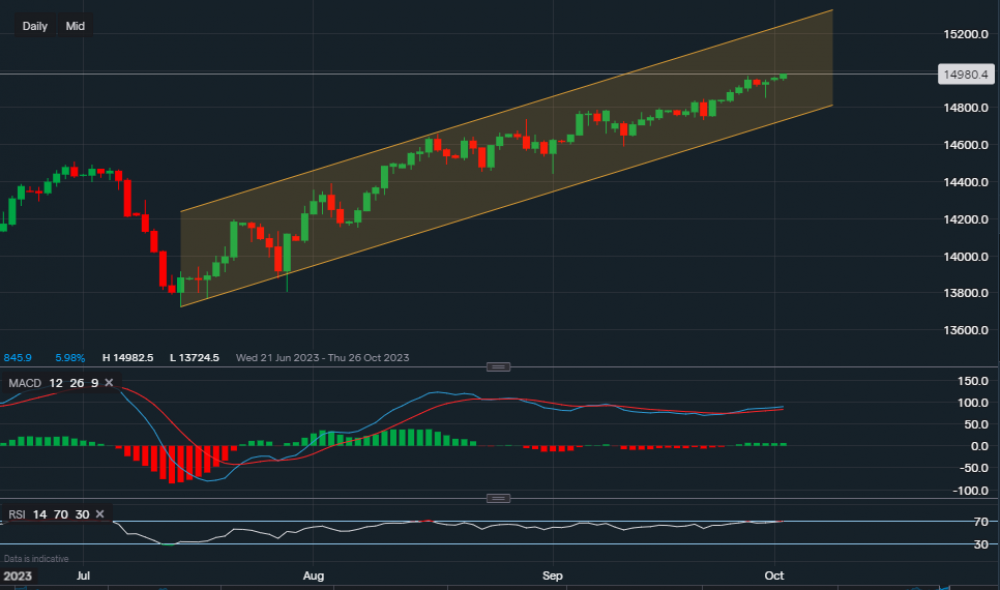
Chart & Data from IG

The US dollar continues to smash the yen as it edges closer to last year’s high of $1.5194. Currently, the dollar is trading at around $1.4980 against the yen, and it remains intact within the channel shown on the chart. We can see the gradual bullish trend rising with the next level of resistance at $1.5029 followed by $1.5194 (2022 October high). A break above the key resistance level could see the dollar continue rising leading to a new high in over 28 years. On the other hand, if last year’s resistance is overpowering, we may see a significant move lower as pessimism would be increased with an opportunity for the bears. Currently, the support sits at $1.4852, a break below it could see an extension lower to the lower trendline of the channel ($1.4768). Looking at the technical indicators, the MACD is just about positive as the volume is low, and the RSI is positive as it reads 69. However, the RSI is almost within the ‘overbought’ territory.