Test- FTSE 100 Kicks Off August on a High as BP and Senior Lead Market Momentum
$11
10 Oct 2025, 13:13
Neutral
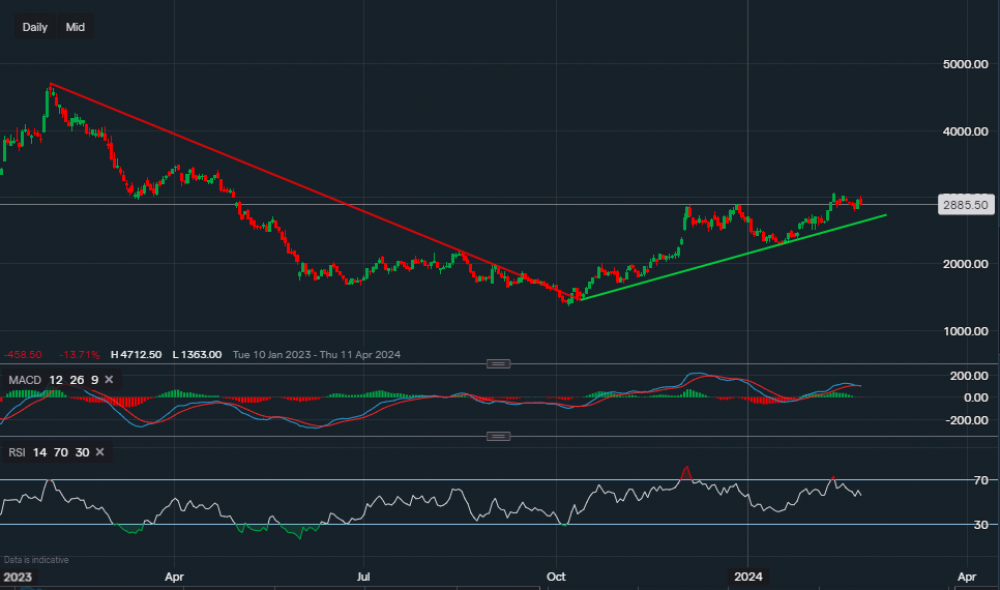
Chart & Data from IG
Taking a look at Victoria's Secret on the daily chart it seems like the bearish trend may have ended with the stock finding a bottom, perhaps a new bullish trend has already begun. Currently, its shares are trading at around $28.85 a share. Looking at the red trendline, this marked the bearish trend where the price broke higher around the $15 mark. Between the 11th-12th of October the price pullback for a test of support, which was the previous resistance. After testing the support, the new rally was underway, rising as much as 101% from October until now. We can see the green trendline is offering support here for the stock after the recent break of the $28.95 resistance. It seems like the price is a little stagnant now as the company’s quarterly earnings report is looming, VS is expected to report in early March. Towards the upside, a break of the resistance of $30.78 would then allow investors to eye up the $34-$35 area. On the other hand, if the earnings sour the sentiment, we may see a test of this trendline support currently reading $27.37. A break below the trendline may then see a further sell-off towards the support of $22.85. The technical indicators are somewhat mixed right now, most likely adjusting themselves ahead of the earnings outcome. The MACD on the daily looks like it could turn negative with a possible bearish divergence at hand, and the RSI has shifted lower as it now reads 56. Although, technically still positive.

Tradable assets:
Min.Deposit:
Max Leverage:
FCA:

Rating:


