Test- FTSE 100 Kicks Off August on a High as BP and Senior Lead Market Momentum
$11
10 Oct 2025, 13:13
Neutral
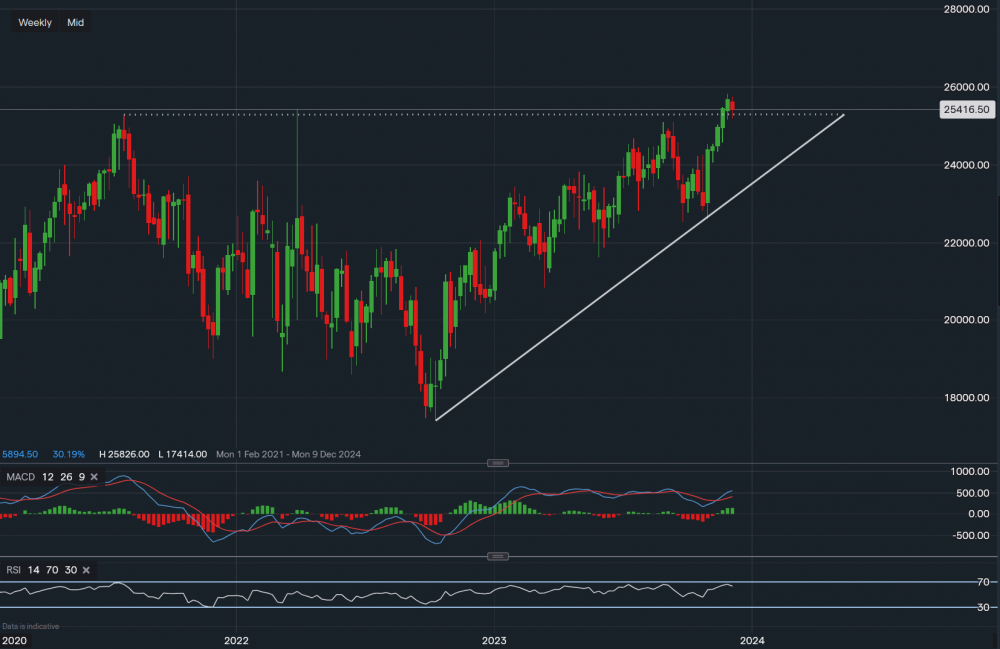
Chart & Data from IG
Visa is currently trading at around $254.19 a share. Last week its shares hit a new all-time high of $258.26 but the price has now slid a little. The previous resistance of $252.80 is now acting as support, a move back into the triangle pattern and below this level may see a retracement lower. In theory, after a new high is achieved the price sometimes tends to fall back before heading higher. In that case, the main support along the ascending trendline would be in focus, which currently reads $240.54. A dip below this level would not necessarily suggest that a reversal trend has formed as there are further support zones lower. But this would have to be analysed if such a scenario arose. If the price were to move back below $252.80, then this once again would be the key resistance for the bulls. Looking at the technical indicators they are looking rather positive, the MACD has turned positive and the RSI reads 63.

Tradable assets:
Min.Deposit:
Max Leverage:
FCA:

Rating:


