Test- FTSE 100 Kicks Off August on a High as BP and Senior Lead Market Momentum
$11
10 Oct 2025, 13:13
Neutral
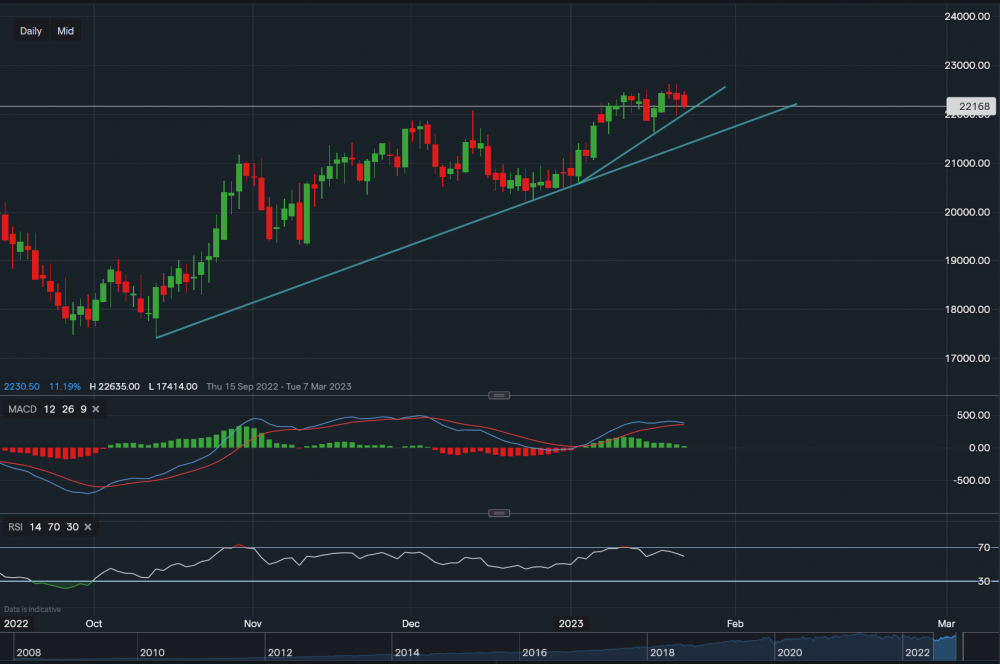
Visa - Chart & Data from IG
Technicals
Visa’s stock is up around 24% since the 13th of October 2022. We can see that support has been established along the trendlines, with the aim of short-term dips before stretching higher. Its stock is currently trading at around $221.86 a share. Support levels below sit at $200 (upper trendline) then at $216.27 then at $215.34 (lower trendline). A break below both of the trendlines could see the price fall towards the major support base resting at $202.15. On the upside, at present, resistance sits at $224.96 then at $226.35. A stretch above these resistance levels may see the price hike towards the $229-$230 price range. Taking a look at the technical indicators, MACD is positive but faltering and so is RSI. RSI reads 59. Note: Visa is expected to report quarterly earnings tomorrow of $2.01 on revenue of $7.7bn. A negative report might impact the price of the stock.

Tradable assets:
Min.Deposit:
Max Leverage:
FCA:

Rating:


