Test- FTSE 100 Kicks Off August on a High as BP and Senior Lead Market Momentum
$11
10 Oct 2025, 13:13
Neutral
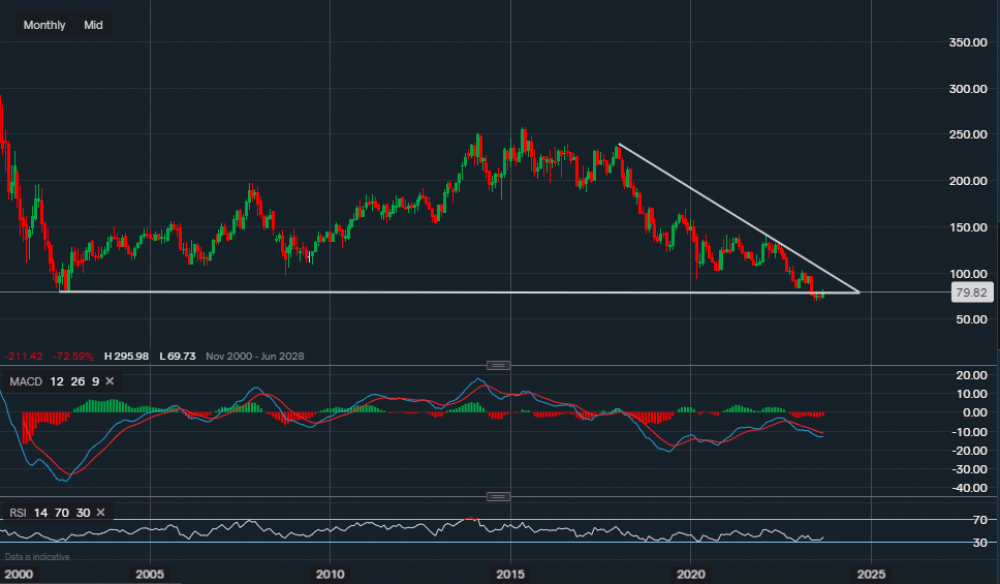
Chart & Data from IG
Financials
If we the 2023 fiscal year to 2022, we can see that operating profit has jumped substantially, even though the revenue only rose marginally. This was as the company generated £9,098M of ‘other income’. As a result, profit for the year after tax and other expenses came in at £12,335M compared to £2,773M in the prior year. This led to a huge jump in earnings per share (7x). Finally, total equity rose 12% YoY with a total value now of £155,521M when looking at total equity and liabilities. The company has also announced earlier in the year that it will undergo a merger with current rival Three, which could be the spark this stock is waiting for looking into the future.
Technicals
If we look at the stock from a technical viewpoint, we can see that on the monthly interval, the price has dipped below the low of 77p last seen in 2002. Reaching a new low of 69p. Now, in theory, this would be an indication that further downside is possible. However, if we take a closer look at the technical indicators, particularly focusing on the MACD and the history of the chart, we can see that October 2002 was the start of an upward trend after the price had a sharp rise. This saw the MACD turn positive the following month and the price of the stock rose 85% over the following 14 months. Additionally, the RSI in October of 2002 was reading 38, the RSI is now reading 38 going into October. Nevertheless, the likelihood of history repeating itself is never guaranteed-, so investors should be wary when following such strategies.
*Minipip’s non-advisory opinion* = a break and close above the descending trendline would be a positive indication of history potentially repeating itself.

Tradable assets:
Min.Deposit:
Max Leverage:
FCA:

Rating:


