Test- FTSE 100 Kicks Off August on a High as BP and Senior Lead Market Momentum
$11
10 Oct 2025, 13:13
Neutral
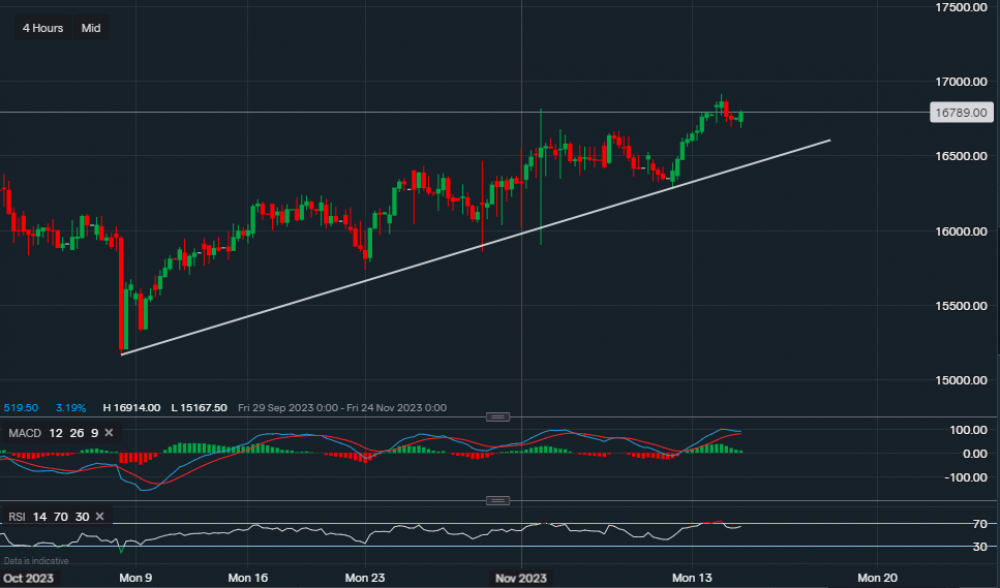
Chart & Data from IG
Taking a look at Walmart ahead of its quarterly earnings tomorrow. Looking at the 4-hourly chart, we can see that the price has maintained an upward trend along the supportive trendline. Currently, its share price is trading at around $167.89, it did reach an all-time high of $169.14 in yesterday’s session but has retraced a little since. The price volatility ahead of the upcoming earnings should be rather flat, with current support at $166.86 and the main resistance at $169.14. A dip below the support level, after the earnings, could see a further move lower towards the supportive trendline for yet another test. The trendline support reads $165.46. On the other hand, if we look towards the upside, a break and close above the resistance level could potentially see a rally beyond $170. Looking at the technical indicators, they continue to suggest a bullish bias. However, the MACD volume has lower and the MACD line has narrowed in with the signal line. The RSI remains positive, reading 64.

Tradable assets:
Min.Deposit:
Max Leverage:
FCA:

Rating:


