Test- FTSE 100 Kicks Off August on a High as BP and Senior Lead Market Momentum
$11
10 Oct 2025, 13:13
Neutral
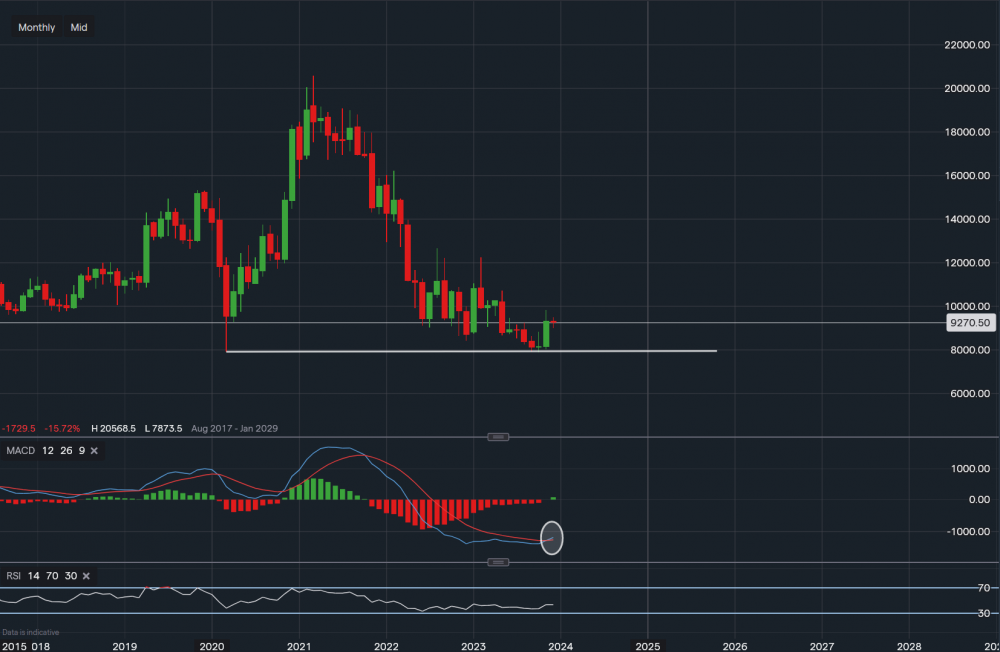
Chart & Data from IG
Taking a look at Walt Disney as it seems like its stock may have found a base of support on the monthly chart. Currently, its stock is trading at around $92.70 a share. It seems like the price tested the COVID low of $79.08 before closing higher at $81.46. The engulfing candlestick for November is a bullish indication of a potential trend shift. However, this is not guaranteed as we can see a similar scenario occurred back in January of 2023, this was followed by a continuation lower. The key support here is now the new low of $78.73, a break below it would suggest that further downside is possible. Towards the upside, resistance now sits at $98.25, which is November’s high. A break and close above could then see a move towards 107.07 and maybe even $110.58. If we look at the technical indicators they are mixed. The RSI is still negative as it reads 43, however, we can see that the MACD has actually now turned positive. The MACD has a bigger influence than RSI in Minipip’s opinion when measuring momentum.

Tradable assets:
Min.Deposit:
Max Leverage:
FCA:

Rating:


