Test- FTSE 100 Kicks Off August on a High as BP and Senior Lead Market Momentum
$11
10 Oct 2025, 13:13
Neutral
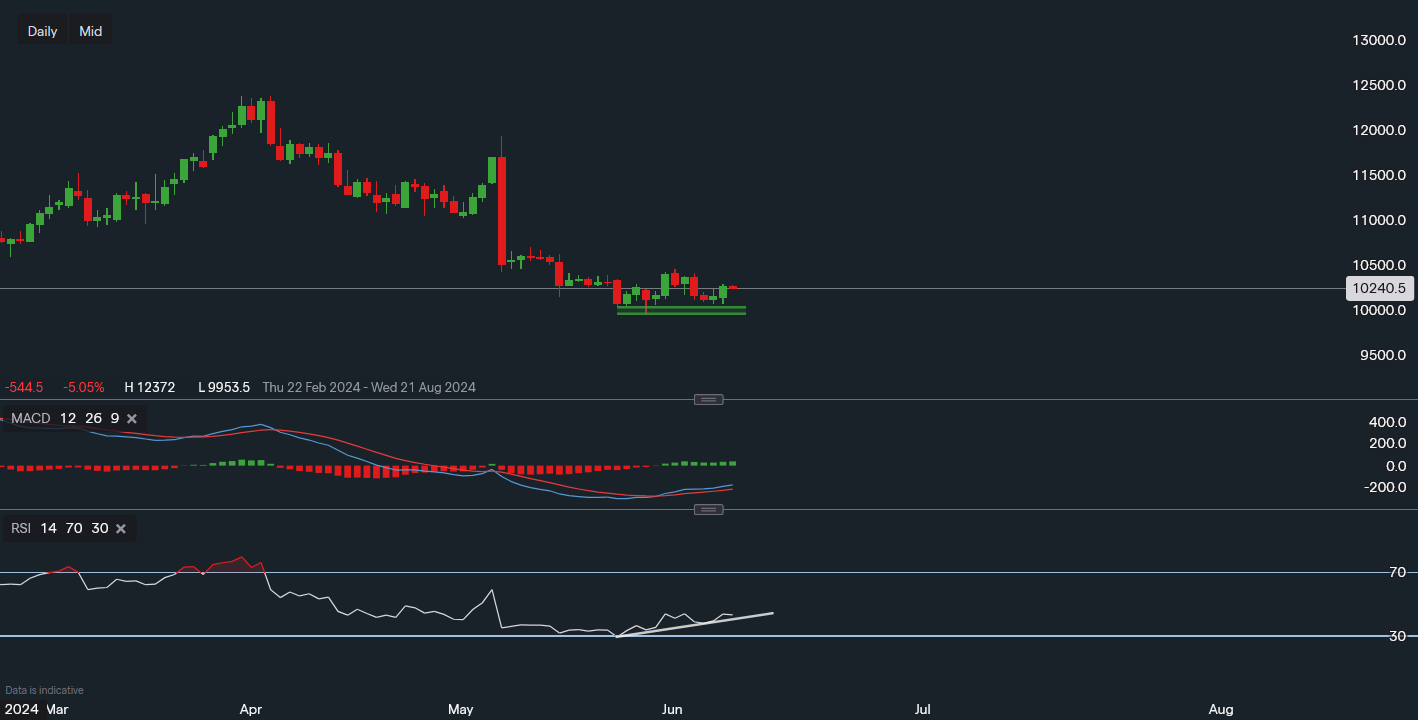
Chart & Data from IG
A potential double bottom here for Disney on the daily chart. Currently, its stock is trading at around $102.40 in the pre-market trade. DIS share price is down over 12% ever since reporting its earnings at the start of May, signs of consolidation are perhaps on the horizon as selling may be overdone. The near-term support is outlined by the green channel, with the low in that area of $99.53. A break below this level would create some concerns amongst investors as it would indicate weakness going into H2 of 2024. A break of $99.53 would shift the focus to the support area of $88-$90. Towards the upside, the near-term resistance reads $104.52. A break and close above this price level could boost the momentum, shifting the focus toward the area of $107-$110. Regarding the technical indicators, they are starting to look more positive. The MACD has turned positive and is now rising, but still below the zero line. The RSI is now also creating high lows, a possible indication that a shift in momentum is occurring.

Tradable assets:
Min.Deposit:
Max Leverage:
FCA:

Rating:


