Test- FTSE 100 Kicks Off August on a High as BP and Senior Lead Market Momentum
$11
10 Oct 2025, 13:13
Neutral
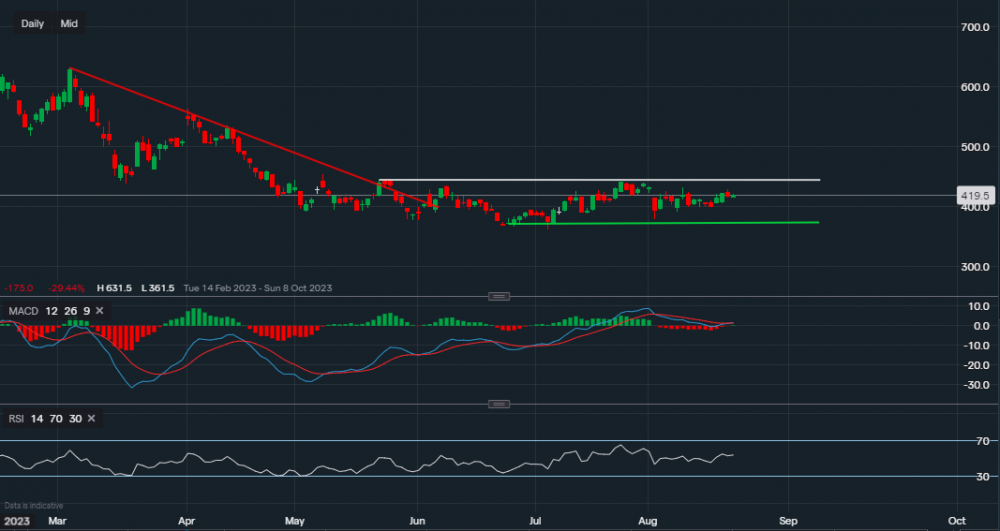
Chart & Data from IG
W&T Offshore is currently trading at around $4.19 a share. Looking at the daily interval, the negative trend is yet to be broken (red trendline). We can see a support base has been created along the green trendline with a low of $3.61. A break below this price level could see the price decline lower towards $3 a share. The price seems to remain rangebound between $3.61 and $4.45 in the channel drawn on the chart, unless there is a clear break above the resistance of $4.45 (white trendline) then the outlook will continue to remain neutral. Though a break above $4.45 would create an incentive to look towards $5-$5.50 a share. The recent rally in oil may have been the reason for the formation of the support base and perhaps a small spark of momentum. But it can be argued that the price of crude has stabilised, at least for the time being, Therefore, we may now see a break towards the upside anytime soon. Looking at the technical indicators, MACD has just turned flat and the RSI is neutral as it reads 53, supporting the current neutral outlook for the short & medium term.

Tradable assets:
Min.Deposit:
Max Leverage:
FCA:

Rating:


