Test- FTSE 100 Kicks Off August on a High as BP and Senior Lead Market Momentum
$11
10 Oct 2025, 13:13
Neutral
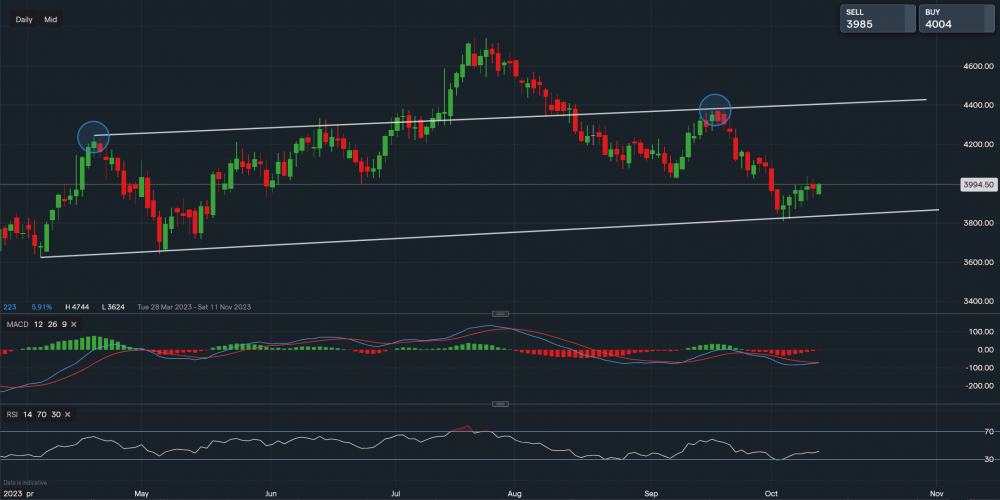
Chart & Data from IG
Wells Fargo’s stock is trading at around $39.94 a share. Simply from a technical perspective, we could argue that there is a slight head and shoulder formation on the daily interval, which tends to be a bearish indication. However, this can be frowned upon. The support along the lower trendline remains robust as the price has tested the trendline on three separate occasions now, bouncing off each time. Support sits at $38.37 (along the trendline), a break below it would have to first test the support of $38.09 and $37.17 before heading any lower. Towards the upside, resistance sits at $40.37. A move above it could see an extension towards $41-$41.50. It is a possibility that the price may just sit within this channel if the earnings come in as expected. The technical indicators are fairly enticing as the MACD volume has now flattened out and seems like it may turn positive. The RSI is also rising towards a neutral stance but it is still negative as it reads 40. Nevertheless, technicals can be lagging indicators and any investing/trading should involve caution as it is at your own risk.

Tradable assets:
Min.Deposit:
Max Leverage:
FCA:

Rating:


