Test- FTSE 100 Kicks Off August on a High as BP and Senior Lead Market Momentum
$11
10 Oct 2025, 13:13
Neutral
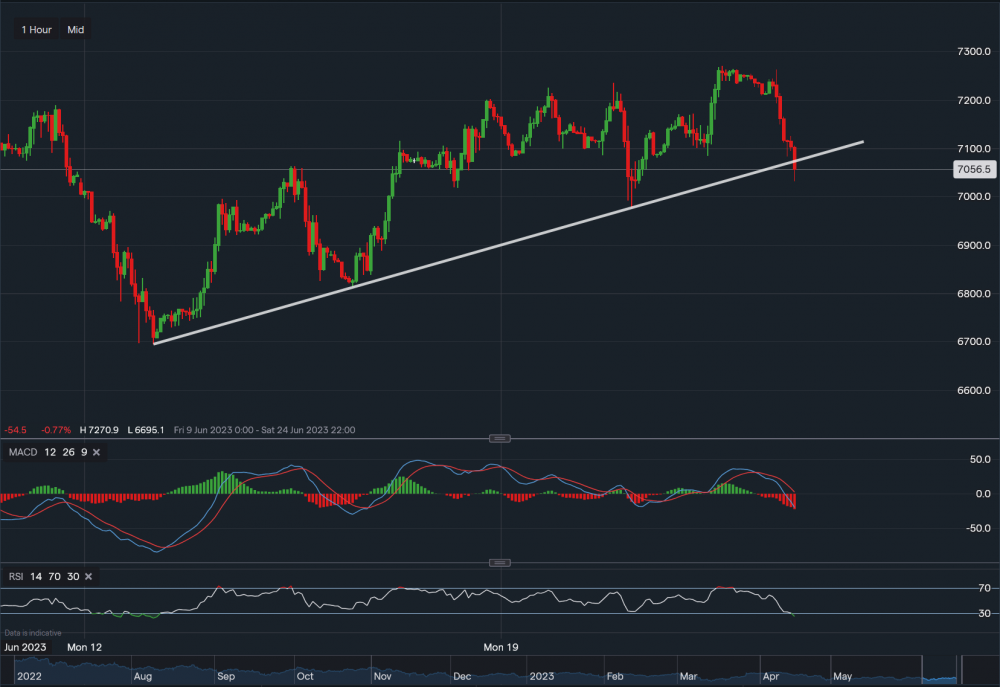
Chart & Data from IG
Taking a look at WTI crude oil as it has just broken through the supportive trendline on the 1 hourly timeframe. Currently trading at around $70.56 a barrel. A close below the trendline could see a move lower towards support sitting at $69.77, which was Tuesday’s low. A break and close below that point may even see a slide lower towards $69 a barrel. If the price consolidates just above the trendline, we may see a set up for an upside move with the first resistance at $70.73. If we look at the overall trend since the 12th of June, the price of oil has been setting higher highs and higher lows, so until a lower low is created, the direction is unclear. Looking at the technical indicators, MACD is negative and so is the RSI as it reads 23. Though RSI is now suggesting that the commodity is ‘oversold’.

Tradable assets:
Min.Deposit:
Max Leverage:
FCA:

Rating:


