Test- FTSE 100 Kicks Off August on a High as BP and Senior Lead Market Momentum
$11
10 Oct 2025, 13:13
Neutral
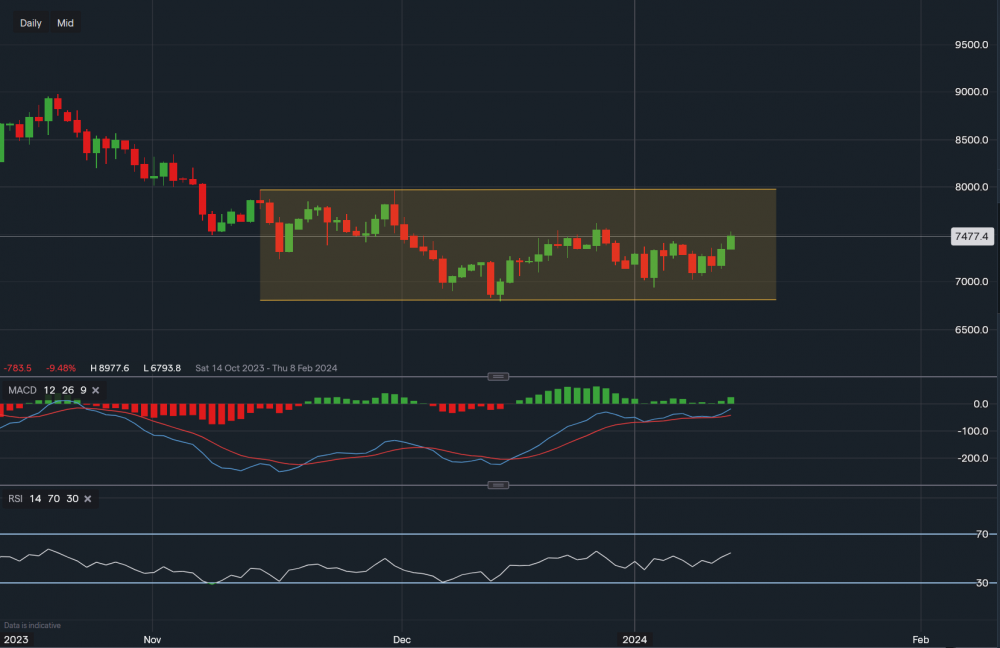
Chart & Data from IG
Taking a look at WTI crude as the implications in the Middle East intensify. Currently, WTI crude is trading at around $74.77 a barrel. We can see that on the daily interval, it is now trading within the channel drawn on the chart, it seems like a support base has been formed at $67.93. However, there is minor support before that at $70.20 and then $69.40. With the implications in the Red Sea, oil prices could rise a little higher over the next couple of weeks due to higher demand and fear of a longer-lasting conflict. The next point of resistance here for WTI is the level of $76.20. A break and close above it could then see an extension towards $79.66, which was last seen in November when equities rallied and the prices of oil fell due to signs of deflation. Looking over at the technical indicators, they are rather positive with a good set-up for a potential move higher. The MACD has just turned positive on the daily again and the RSI is on the rise as it reads 54.

Tradable assets:
Min.Deposit:
Max Leverage:
FCA:

Rating:


