Test- FTSE 100 Kicks Off August on a High as BP and Senior Lead Market Momentum
$11
10 Oct 2025, 13:13
Neutral
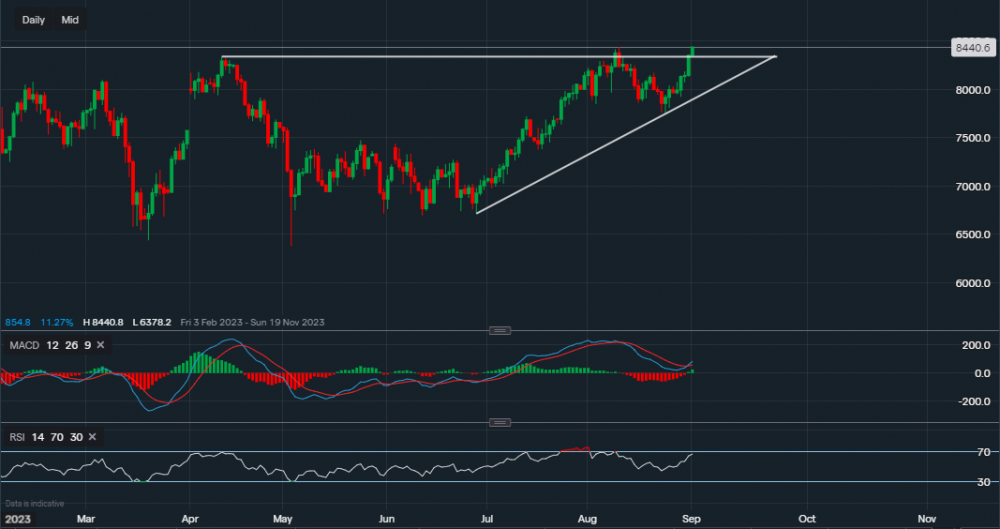
Chart & Data from IG
Crude seems to have broken above the resistance of $83.41, a level last seen in April. Currently trading at around $84.40 a barrel, if it manages to close above this resistance then it may continue its bull run. The aim would then be somewhere between $86-$86.50 a barrel. The previous resistance of $83.41 is now acting as support, a move back below this level would suggest the momentum may have run out and a short-term pullback is upcoming. We would then look at support along the ascending trendline which reads $80.56. A break below could see a test of $77.55, a support level created earlier this month. The PCE data might be the driving factor here, in either direction. If we take a look at the technical indicators, MACD has just turned positive on the daily timeframe and the RSI reads 66. Suggesting the positive momentum is there for a push higher.

Tradable assets:
Min.Deposit:
Max Leverage:
FCA:

Rating:


