Test- FTSE 100 Kicks Off August on a High as BP and Senior Lead Market Momentum
$11
10 Oct 2025, 13:13
Neutral
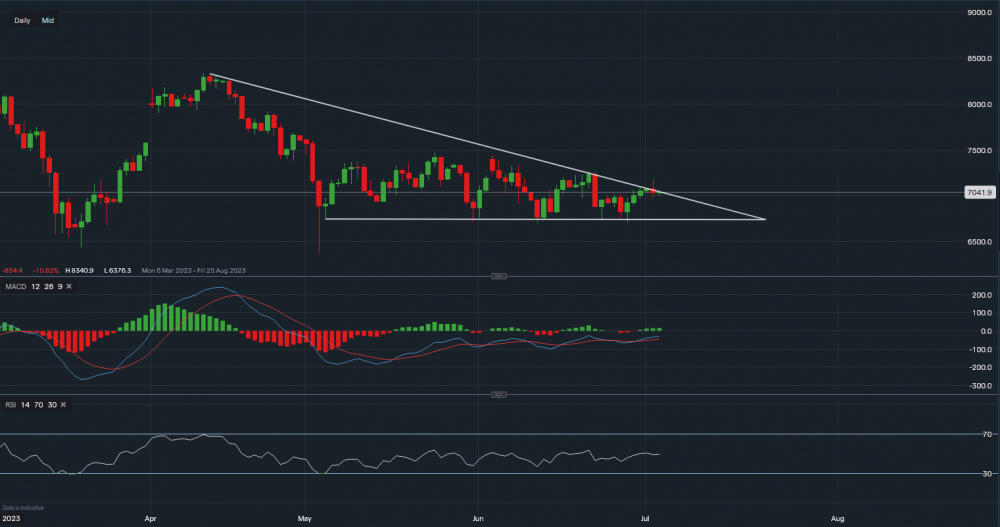
Chart & Data from IG
Taking a look at WTI crude oil as it is still trading within this descending triangle. Currently trading at around $70.41 a barrel, we can see that on the daily timeframe it tried to breakout in yesterday’s session but it got rejected. If we see a clear break towards the upside over the next couple of days, we could then look towards resistance levels sitting at $71.82 then at $72.70, and then potentially a push towards the major level at $74.38. Though this would require some strong momentum. On the other hand, if another rejection happens, we could see a fall towards $69.40 then $68.76, and then even as low as $68 a barrel. Looking at the technical indicators, MACD is slightly positive and the RSI is neutral as it reads 50.

Tradable assets:
Min.Deposit:
Max Leverage:
FCA:

Rating:


