Test- FTSE 100 Kicks Off August on a High as BP and Senior Lead Market Momentum
$11
10 Oct 2025, 13:13
Neutral
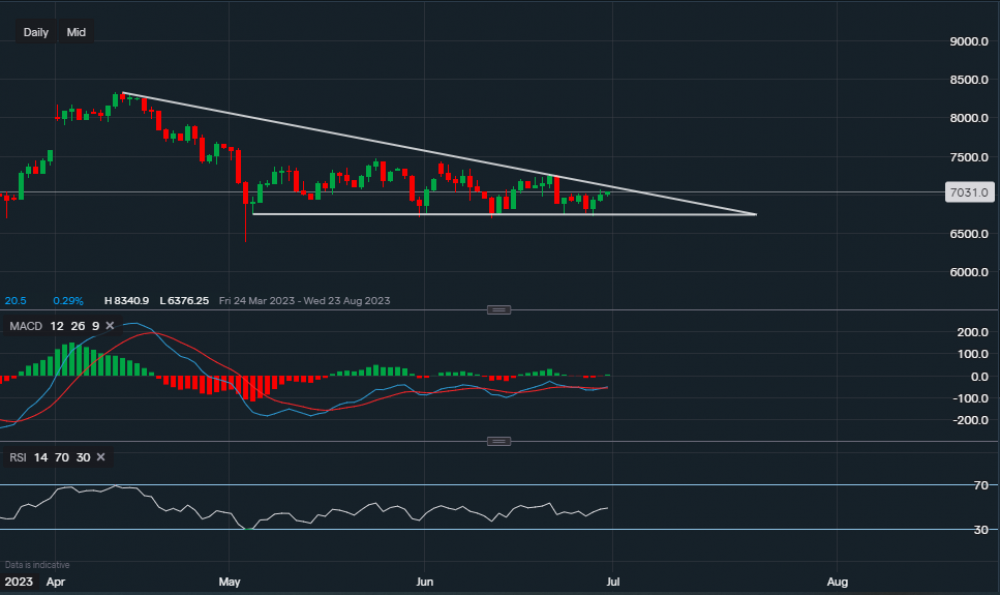
Chart & Data from IG
Taking a look at WTI Crude oil as it has formed a descending triangle on the daily timeframe. From a technical perspective, we can see that the support base has various levels of support (bottom trendline), with the key at $66.95. A break and close below this base could see oil plummet lower towards $63.76. A fall below $63.76 could even see a move towards $60 a barrel. On the other hand, we can see that the price is approaching a major resistance point along the descending trendline of the triangle, the resistance is roughly around $71.07. A break and close above the trendline may see oil climb higher, with the targets then of $72.70 then $74.38 and then $74.71. Though it will require some serious momentum to reach $74.71, a break above it may indicate that a potential bull trend is forming. Looking at the technical indicators, MACD is flat but looks like it could turn positive and RSI is similar, neutral to rising,

Tradable assets:
Min.Deposit:
Max Leverage:
FCA:

Rating:


