Test- FTSE 100 Kicks Off August on a High as BP and Senior Lead Market Momentum
$11
10 Oct 2025, 13:13
Neutral
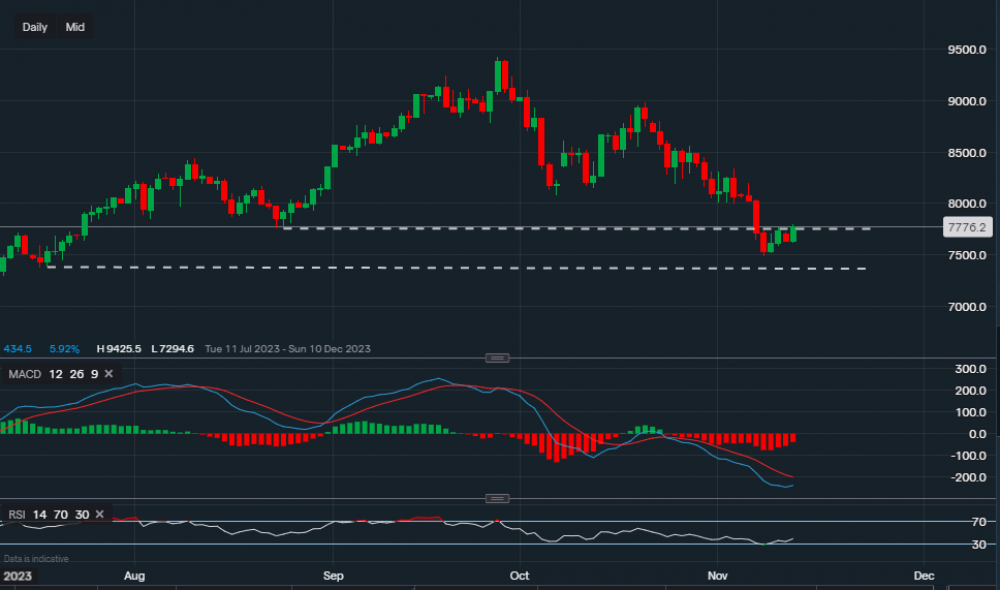
Chart & Data from IG
WTI crude is now trading at around $77.76 a barrel. We can see that the price of oil has fallen below the support of $77.56 but has now bounced back to this level (flipped from support to resistance). A close above the upper trendline of the channel drawn on the chart could suggest that some consolidation between $76-$78 is likely for the commodity in November. However, a move below last Wednesday’s low of $74.92 may see the price of oil slide lower towards the support of $73.78. This would be vulnerable territory for oil bulls as a break below $73.78 could spark a bear trend forcing the price to retreat back to the lows seen earlier in the year. Looking at the technical indicators, the MACD is negative and so is the RSI as it reads 38.

Tradable assets:
Min.Deposit:
Max Leverage:
FCA:

Rating:


