Test- FTSE 100 Kicks Off August on a High as BP and Senior Lead Market Momentum
$11
10 Oct 2025, 13:13
Neutral
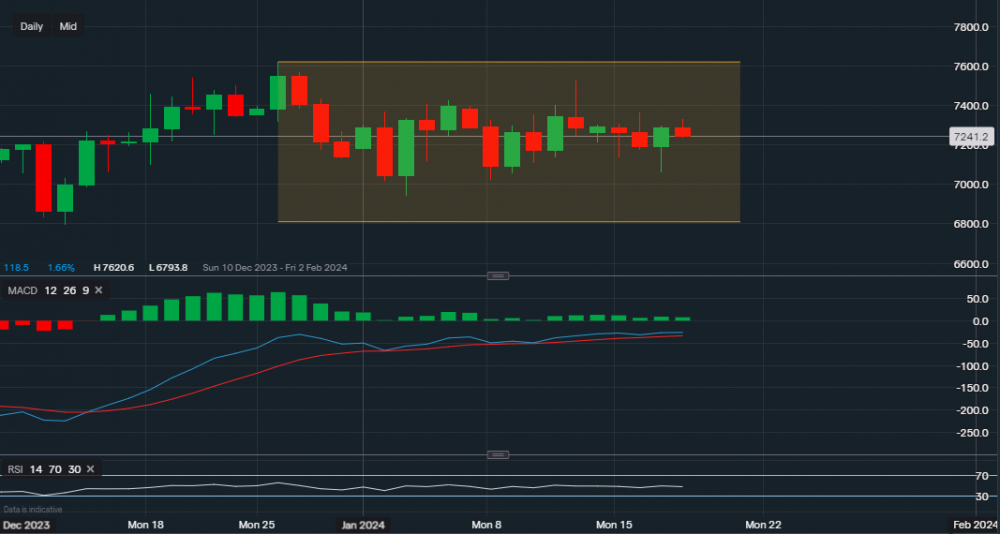
Chart & Data from IG
WTI crude continues to trade in a tight range, this concentration of buying and selling pressure is making it difficult for the market to move in either direction. This could lead to a drastic price move once the range is broken either up or down. Currently, WTI is trading at around $72.41 a barrel. We can see the support sits at $70.60 followed by $69.40, whereas resistance, reads $73.66 then $75.27 and then $76.20. A move below $69.40 would require the bears to first test the support of $67.93 before any moves lower. Towards the upside, if the bulls can overcome $76.20 then $79 would be the next target. Looking at the technical indicators, they paint a similar picture to the price. The MACD is only a tad in the green but arguably flat and the RSI is also neutral as it reads 49.

Tradable assets:
Min.Deposit:
Max Leverage:
FCA:

Rating:


