Test- FTSE 100 Kicks Off August on a High as BP and Senior Lead Market Momentum
$11
10 Oct 2025, 13:13
Neutral
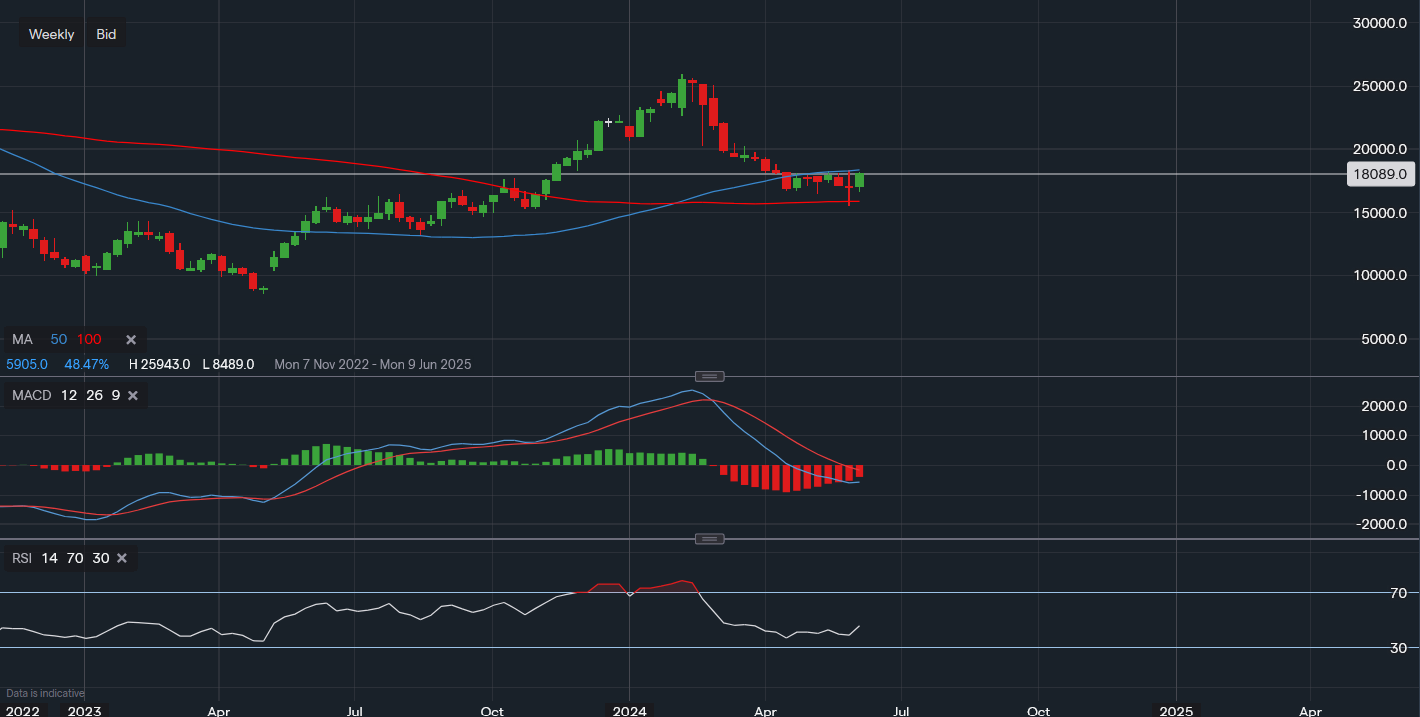
Chart & Data from IG
Zscaler: Closed last week at $180.89 a share.
Applying the 50 & 100-day moving averages to the chart, we can see that after falling below the 50MA and testing the 100MA, the stock had a strong week last week. Going into this week and the near term, the resistance here is along the 50MA which currently reads $183.54. A move back above the 50MA could lead to some consolidation for investors, creating an incentive for strategic buying opportunities going into the end of the second quarter. Following this scenario, the $200 mark would be the next psychological key area. The support lies along the 100MA, which has been proving its resilience for now. With the 100MA reading $158.65, a strong break below this level could lead to a sell-off to last year’s lows. Looking at the technical indicators, they seem to be stabilising, creating greater confidence for investors. The MACD seems like it’s starting to turn flat and the RSI is now rising, reading 45.

Tradable assets:
Min.Deposit:
Max Leverage:
FCA:

Rating:


