Test- FTSE 100 Kicks Off August on a High as BP and Senior Lead Market Momentum
$11
10 Oct 2025, 13:13
Neutral

Bollinger Bands are a technical trading tool created by John Bollinger in the early 1980s. The bands consist of a trading range, with an upper limit, a 20-period SMA and a lower limit. The levels which the Bollinger Bands produce help investors and traders determine whether prices are high or low on a relative basis.
The average middle band (20 period SMA) can help determine the intermediate-term trend. For example, if a stock is moving from the upper band to the lower band, in a tight range, that could be an indication that the trend is now bearish (negative) and vice versa. The depth to which the fall happens could be as low as the lower Bollinger band, but if momentum, volume, or sentiment changes the bands could expand and the stock could fall further. If price action results in the stock closing outside the band, this could be an indication that we could continue to go lower. this concept also works to the upside.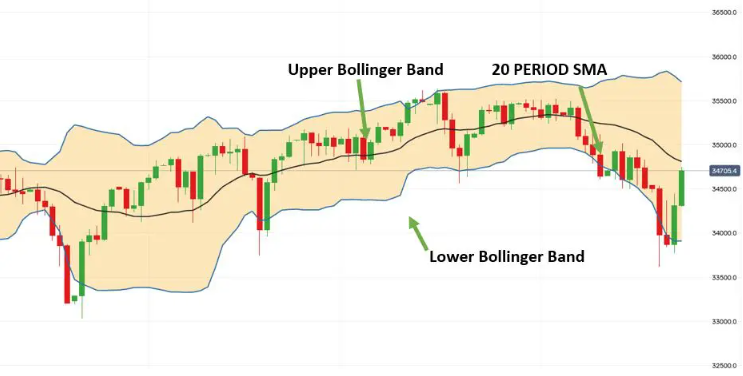
Some traders view the upper and lower Bollinger Bands as overbought and oversold market conditions. If a stock drops suddenly and the bands are in a tight range it could be an indication that the sell-off in principle was overdone and thus a correction back into the band is possible. In this case, a trader would look to go long the asset on the anticipation it comes back to the 20-period SMA – this concept also works if an asset rises rapidly and breaks outside the upper Bollinger band, a trader would then look to short the market in anticipation that the asset falls back down to the 20-period SMA.
This is another strategy which traders use to help determine breakouts. A trader can visually identify when the price of an asset is consolidating because the upper and lower band range becomes tighter. This would indicate that a period of low volatility is present. A trader would then anticipate that a larger move is about to happen, and the direction could be determined by where the prices sit within the band. If prices sit above the moving average and within the upper band expanding, the volume could cause a breakout to the upside. If this happened, the bands would expand and a confirmation of this would be to see the candlestick session end outside of the band along with strong volume/sentiment.

Tradable assets:
CFDs, Spread Betting, Managed Portfolios, ISAs, Options
Rating:
FCA: