Test- FTSE 100 Kicks Off August on a High as BP and Senior Lead Market Momentum
$11
10 Oct 2025, 13:13
Neutral

The MACD is another very popular trading indicator that uses moving averages to track the momentum of an asset. The MACD is calculated by subtracting the 26-period EMA from the 12-period EMA. The result of this calculation is known as the MACD line. An additional 9-day EMA is also plotted onto the graph, and this is known as the ‘signal line’
Generally speaking, when the ‘signal line’ crosses above the MACD line this is an indication to buy and when the ‘signal line’ crosses below the MACD line this is an indication to sell (or short).
An Example of this is below:
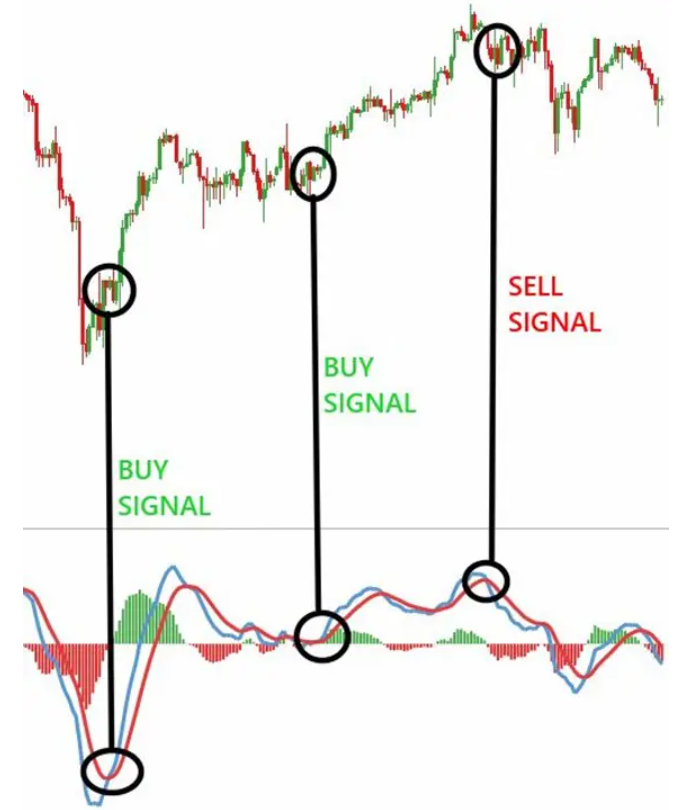
As the diagram shows here, when the blue MACD line crosses over the red ‘signal line’ this would be a suggestion to buy this asset. Vice versa, when the blue MACD line crosses below the red ‘signal line’ this would be a signal to either short or sell trade.

Tradable assets:
CFDs, Spread Betting, Managed Portfolios, ISAs, Options
Rating:
FCA: