Test- FTSE 100 Kicks Off August on a High as BP and Senior Lead Market Momentum
$11
10 Oct 2025, 13:13
Neutral
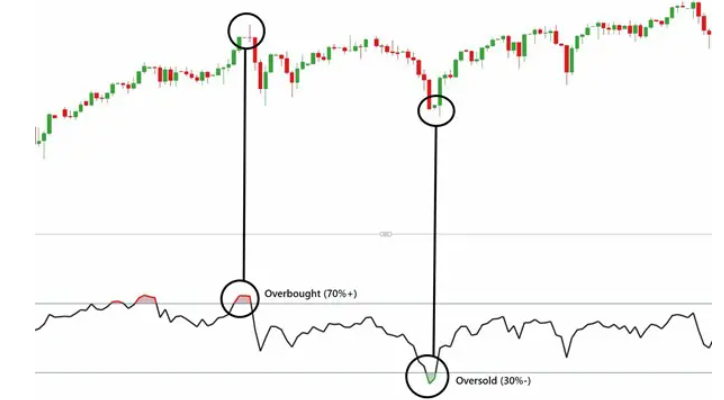
The Relative Strength Index (commonly known as the RSI) is another technical indicator used by analysts. It uses the momentum in price movements to determine overbought or oversold conditions on a chart. Anything under the value of 30 is considered oversold which could indicate undervalued conditions or a reversal in a downtrend whereas anything over the value of 70 is considered overbought which could indicate overvalued conditions or a reversal in an uptrend.

Tradable assets:
CFDs, Spread Betting, Managed Portfolios, ISAs, Options
Rating:
FCA: