Test- FTSE 100 Kicks Off August on a High as BP and Senior Lead Market Momentum
$11
10 Oct 2025, 13:13
Neutral

Fibonacci retracement levels introduce the concept of ‘Fibonacci’ (Fib) sequences into stock market technical analysis, whereby investors use various fib zones as indicators of support and resistance levels. Generally speaking, fib regions are derived from structures created by previous price action, such as a short-term bull rally, in which an analyst would stretch the fib tool from the low to the high of a given period of price action. Illustrated below is the fib tool in use:
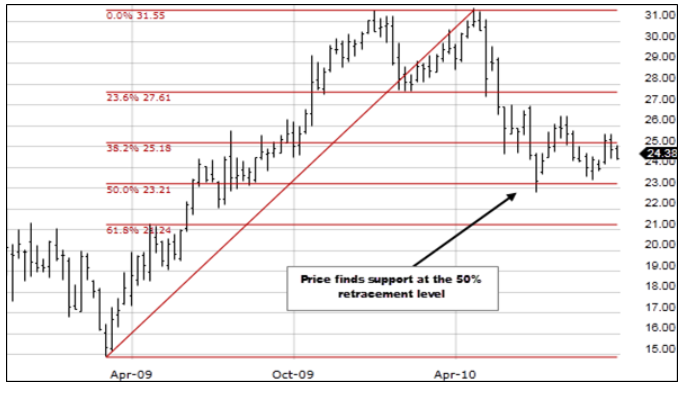
Depending on the market being analysed, measuring a 50% decline from the previous uptrend is a common retracement level to observe. The image above points at the 50% retracement level, which denotes the percentage fall of price action relative to the bullish move measured using the fib tool from the low ($15) to the high ($31). So, given the price action from Apr-09 to early Apr-10, the diagram above highlights a 50% pullback of the price in comparison to the initial uptrend from $15 to $31. As a result, we reach a price level of $23 by computing ($31 – ($16 x 0.5)) = $23, hence why the 50% support level from the bull leg stands at $23. The same principle applies to a retracement of 38.2% or 61.8% since these zones are all pull-backs expressed as percentages of the previous bullish leg. For instance, if we pull back 61.8% in this case, then the market price has fallen by 61.8% of the initial bullish move to $21.24 (to be precise). Subsequently, a retracement of 100% would situate the market price back to where the original trend line was drawn from, at $15.
Whether price action is up or down, the market tends to retrace a substantial portion of the previous trend, before continuing to follow the long-term trend. The key levels to look out for are typically: 23.6%, 38.2%, 50%, 61.8%, 78.6% and 88.6%. However, investors are advised not to solely rely upon these mathematical measurements, as they are not always deemed accurate, since the nature of the market strongly comes into question when speculating price movement. Fib levels can be rapidly disrespected during periods of volatility or during various economic events, e.g. interest rate decisions, thus symbolising the importance of using other indicators alongside fib retracements to predict market action. Traders can use fib levels to place orders, set stop-losses or input price targets; it vastly depends on each individual's trading style or strategy.
Investors aim to make stock market predictions using a variety of tools and chart patterns, however, the fib tool explicitly aims to help a speculator forecast key areas of support or resistance. Using a logical sequence of numbers in technical analysis is generally a safe bet since fib numbers are appropriate for describing complex correlations between trends and waves in numerous markets. This makes for a key confluence factor to add to any trading strategy, mainly due to the sheer flexibility of the fib tool against almost any market movement.
Firstly, fib levels cannot be relied upon for entirely predicting price action, but rather as an indicator to use alongside other means of technical analysis. Additionally, it can be difficult to determine which fib ratio has the greatest priority, since the market could obliterate through all major fib levels and reverse at the 88.1% retracement, thus leaving a trader, who was expecting price action to only pull back to 50%, in a different situation to their initial price prediction. Lastly, some traders face great difficulty in finding which ‘low’ and ‘high’ price points to use on the chart, since the fib tool can be drawn from any point and on any time frame, which means using fib levels can become fairly complicated, and at times, conflicting across different chart setups. In this instance, perhaps fundamental analysis should be considered alongside technical analysis techniques to gauge a clearer understanding of where a stock’s price might head.
Integrating Fibonacci retracement levels into the technical analysis of various securities is deemed effective, especially as one of the most commonly used trading indicators. Some perceive fib zones to be more efficient for Forex markets, relative to stock market analysis, since stocks are more susceptible to general economic or company-related news, such as earnings reports and the appointment of a new CEO. Alternatively, Forex markets typically fluctuate based on the supply and demand of international currencies. Nevertheless, fib retracements assist with basic technical analysis and can help determine key areas to observe for investors for setting price targets and stop-losses. However, many traders often utilise other indicator tools to make more accurate predictions of price movement.

Tradable assets:
CFDs, Spread Betting, Managed Portfolios, ISAs, Options
Rating:
FCA: